|
SPY
Price at
time of
trade |
 |
 |
Value |
 |
 |
| Jan 22 10 |
109.90 |
Bought 30 March 20 spy
puts
107 @ 2.25 -( The 107 was an error. I meant to select
109.00) |
44.50 |
(6794.50) |
|
|
| Jan 25 10 |
108.20 |
Sold 30 March 20 spy puts 107 @ 2.72 |
44.50 |
8115.50 |
1321.00 |
1321.00 |
| Jan 25 10 |
110.00 |
Bought 30 March 20 spy puts 110 @ 3.70 |
44.50 |
(11144.50) |
|
|
| Jan 27 10 |
108.33 |
Sold 30 Mar 20 spy puts @ 4.15 (All day the
market fluctuated and by 2:20 it hit 108.33 and the Put
value was $4.62. I put in my stop loss at $4.15 which was
the previous days close and was taken out a short while
later) |
44.50 |
12405.50 |
1261.00 |
2582.00 |
| Jan 27 10 |
110.01 |
Bought 20 March 20 spy puts 110 @ 3.65 -
(Changed to 20 spy puts as the market seems stronger than I
would expect and keeps bouncing off the 108 support. 20 spy
puts
means a smaller loss if I am wrong.) |
32.00 |
(7332.00) |
|
|
| Jan 28 10 |
108.00 |
Sold 20 March 20 spy puts 110 @ 4.15 |
32.00 |
8268.00 |
936.00 |
3517.00 |
| Jan 28 10 |
109.75 |
Bought 20 March 20 spy puts $110 @ 3.95 -
(My sell is at 4.30 on these - good till close of today) |
32.00 |
(7932.00) |
|
|
| Jan 28 10 |
108.65 |
Sold 20 March 20 spy puts $110 @ $4.30 |
32.00 |
8568.00 |
636.00 |
4153.00 |
| Jan 29 10 |
109.70 |
Bought 20 March 20 spy puts $110 @ 3.65 on
the bounce in the morning. I have not put a sell in at this
time. I am hoping the market will rebound and this is the
bottom. I have a stop loss on this at 3.25 to close with a
small loss which is not of concern. This is not a position
for trading. It is a position in the event of a more severe
correction. I have made enough profit on the position to
afford me a net debit on this position, but I want to be
sure that it is not just a bounce but a firm bottom from
which we can move higher. |
32.00 |
(7332.00) |
|
|
| Jan 29 10 |
107.20 |
Sold 20 Mar 20 spy puts $110 @ 5.10 (The
market fell through the 108 support, but at this level I
would like to take my profit and add it to my cash cushion.
Next week could see a much lower market - but you never
know, we could get a move higher and set a bottom in -
personally I think this is unlikely) |
32.00 |
10168.00 |
2836.00 |
6989.00 |
| Feb 1 10 |
108.87 |
Bought 20 March 20 spy puts $108 @ 3.10 -
Stop Loss is at $2.60 |
32.00 |
(6232.00) |
|
|
| Feb 2 10 |
109.61 |
Sold 20 March 20 spy puts $108 @ 2.60
(sold out at my stop loss) |
32.00 |
5168.00 |
(1064.00) |
5925.00 |
| Feb 4 10 |
108.68 |
Bought 20 Mar 20 spy puts $108 @ 3.05 My
sell is in at $ 3.65 (stop loss at $2.45) |
32.00 |
(6132.00) |
|
|
| Feb 4 10 |
107.75 |
Sold 20 Mar spy puts $108 @ 3.65 |
32.00 |
7268.00 |
1136.00 |
7061.00 |
| Feb 5 10 |
106.50 |
Bought 20 Mar spy puts 106 @ 3.31
(stopped out at 4.30) I started with a stop loss at .50
cents above my price but as the market fell I continued to
move my stop loss until I was stopped out at $4.30 |
32.00 |
(6652.00) |
|
|
| Feb 5 10 |
104.95 |
Sold on stop loss 20 Mar spy puts 106 @
4.30 |
32.00 |
8568.00 |
1916.00 |
8977.00 |
| Feb 8 10 |
106.68 |
Bought 30 spy puts MAR20 106 @ 3.15
STOPLOSS set at 2.80 which is just above the high for today
at this point and my sell is in at 3.55 which is the low for
the day to this point. I will adjust the sell if we really
start to move lower but I think most of the selling pressure
will be after 3:30 as we move to the close and traders
prepare for the next day. |
44.50 |
(9494.50) |
|
|
| Feb 8 10 |
105.85 |
Sold at sell point 30 spy puts 20MAR10 106
@ 3.55
I will reassess tomorrow and put these spy puts back in place.
The CASH CUSHION is now at 10088.00 which gives me more room
for putting in my stop loss. |
44.50 |
10605.50 |
1111.00 |
10088.00 |
| Feb 24 10 |
110.59 |
Bought 30 spy puts 17APR10 110 @ 3.07.
COMMENTS: My stop is in at 2.75 and my sell is presently at
3.50 but I will alter this as the market direction dictates.
I am not expecting a severe selloff or anything like that. I
do think the market weakness remains and the run up of the
last few days has left the market oversold and venerable to
any bad news. Remember that I would not recommend this trade
to anyone. I have already built up a large cash position of
10,088.00 to Feb 8, so I can afford to be wrong on this
position. |
44.50 |
(9254.50) |
|
|
| Feb 25 10 |
109.34 |
Sold 30 spy puts 17APR10 110 @3.67 -
COMMENTS: The market gapped down at the open and my put
position which I had a sell in at 3.50 was filled at 3.67.
On any bounce I will buy back in. |
44.50 |
10,965.50 |
1711.00 |
11,799.00 |
| Mar 26 10 |
116.88 |
Bought 20 spy puts 22MAY10 117@ 3.02
Comments:
I could easily be early but yesterday's 120 point advance
and then subsequent fall could easily indicate this market
is due for a rest. My stop is in at 2.50 and my sell at
3.55. I will adjust as the day progresses. |
32.00 |
(6072.00) |
|
|
| Mar 29 10 |
116.98 |
Sold 20 spy puts 22MAY10 117 @ 2.88
Comments: The market failed to break. I have always found
that my own technical indicators are better at calling a
market downturn than relying on instinct. While the market
looks choppy, my 20-30-50 indicators are not in any danger.
I should have stayed with my indicators and waited for the
indicators to give that true market down call before buying
spy puts. |
32.00 |
5728.00 |
(344.00) |
11,455.00 |
| Apr 19 10 |
118.76 |
Bought 20 spy puts 22MAY10 119 @ 2.10
Comments: Overall I think the market needs to pull back and
I think there is enough issues that this will happen. I have
put my stop loss in at 1.75 and my sell in for today at
2.50. I will move both of these as the market dictates. |
32.00 |
(4232.00) |
|
|
| Apr 19 10 |
118.55 |
Sold 20 spy puts 22MAY10 119 @ 2.50 |
32.00 |
4968.00 |
736.00 |
12,191.00 |
| May 3 10 |
119.61 |
Bought 10 spy puts 30JUN10 119 @ 3.46 |
19.50 |
(3479.50) |
|
|
| May 3 10 |
119.33 |
Sold 10 spy puts 30JUN10 119 @ 3.55
It is obvious by stocks such as MCD setting a new 52 week
high that the advance/decline ratio is still showing us a
market that has some strength. Shortly after buying my spy
puts,
I watched the market and felt compelled to sell my spy puts as I
believe I will be buying them again at a better price. This
market wants to rally, even perhaps for just the one day. |
19.50 |
3530.50 |
51.00 |
12242.00 |
| May 3 10 |
120.20 |
Bought 10 spy puts 30JUN10 119 @ 3.12
Comments: I have bought these at the close of the day. While
today's rally looks nice the volume is low for such a move
higher. My indicators do not show a market in trouble, but
my instincts tell me that the market is too overbought, the
debt situation in Europe remains a concern, the rally today
is too light in volume, the market needs more time to
consolidate before moving higher. It is just a question of
timing. I am purchasing spy puts BECAUSE I have a large cash
cushion in the event that I am wrong and the market moves
higher. |
19.50 |
(3139.50) |
|
|
| May 4 10 |
117.39 |
Sold 10 spy puts 30JUN10 119 @ 4.92 |
19.50 |
4900.50 |
1761.00 |
14003.00 |
| May 5 10 |
117.57 |
BOUGHT 5 spy puts 19JUN10 117 @ 3.22 |
13.25 |
(1623.25) |
|
|
| May 5 10 |
117.65 |
BOUGHT 5 spy puts 19JUN10 117 @ 3.20 |
13.25 |
(1613.25) |
|
|
| May 5 10 |
117.70 |
BOUGHT 5 spy puts 19JUN10 117 @ 3.18 |
13.25 |
(1603.25) |
|
|
| May 5 10 |
117.68 |
BOUGHT 5 spy puts 19JUN10 117 @ 3.19 |
13.25 |
(1608.25) |
|
|
| May 5 10 |
117.58 |
BOUGHT 5 spy puts 19JUN10 117 @ 3.21 |
13.25 |
(1618.25) |
|
|
| May 5 10 |
117.49 |
BOUGHT 5 spy puts 19JUN10 117 @ 3.29 |
13.25 |
(1658.25) |
|
|
| May 5 10 |
116.42 |
SOLD 10 spy puts 19JUN10 117 @ 3.71 |
19.5 |
3690.50 |
|
|
| May 5 10 |
116.37 |
SOLD 10 spy puts 19JUN10 117 @ 3.75 |
19.5 |
3730.50 |
|
|
| May 5 10 |
116.33 |
SOLD 10 spy puts 19JUN10 117 @ 3.81 |
19.5 |
3790.50 |
1487.00 |
15490.00 |
| May 6 10 |
116.86 |
Bought 5 spy puts 19JUN10 117 @ 3.72 |
13.25 |
(1873.25) |
|
|
| May 6 10 |
116.94 |
Bought 5 spy puts 19JUN10 117 @ 3.63 |
13.25 |
(1828.25) |
|
|
| May 6 10 |
116.88 |
Bought 5 spy puts 19JUN10 117 @ 3.70 |
13.25 |
(1863.25) |
|
|
| May 6 10 |
115.85 |
Sold 5 spy puts 19JUN10 117 @ 4.20 |
13.25 |
2086.75 |
213.50 |
15703.50 |
| May 6 10 |
115.49 |
Sold 5 spy puts 19JUN10 117 @ 4.53 |
13.25 |
2251.75 |
423.50 |
16127.00 |
| May 6 10 |
116.03 |
Bought 5 spy puts 19JUN10 117 @ 3.90 |
13.25 |
(1963.25) |
|
|
| May 6 10 |
116.00 |
Bought 5 spy puts 19JUN10 117 @ 3.93 |
13.25 |
(1978.25) |
|
|
| May 6 10 |
115.40 |
Sold 5 spy puts 19JUN10 117 @ 4.55 |
13.25 |
2261.75 |
398.50 |
16525.50 |
| May 6 10 |
115.10 |
Sold 5 spy puts 19JUN10 117 @ 4.80 |
13.25 |
2386.75 |
423.50 |
16949.00 |
| May 6 10 |
114.65 |
Sold 5 spy puts 19JUN10 117 @ 5.24 |
13.25 |
2606.75 |
628.50 |
17577.50 |
| May 6 10 |
112.80 |
Bought 10 spy puts 19JUN10 115 @ 4.20 |
19.50 |
(4219.50) |
|
|
| May 6 10 |
111.83 |
Sold 10 spy puts 19JUN10 115 @ 6.23. |
19.50 |
6210.50 |
1991.00 |
19548.50 |
| May 7 10 |
113.50 |
BOUGHT 60 spy puts 22MAY10 113 @ 2.38 |
82.00 |
(14362.00) |
|
|
| May 7 10 |
109.80 |
SOLD 60 spy puts 22MAY10 113 @ 5.02 |
82.00 |
30,038.00 |
15676.00 |
35224.50 |
| May 7 10 |
113.05 |
Bought 50 spy puts 19JUN10 113 @ 4.28 |
69.50 |
(21469.50) |
|
|
| May 7 10 |
111.40 |
SOLD 50 spy puts 19JUN10 113 @ 5.87 |
69.50 |
29280.50 |
7811.00 |
43035.50 |
| May 10 10 |
116.16 |
BOUGHT 30 spy puts 19JUN10 116 @ 3.75 |
44.50 |
(11294.50) |
|
|
| May 11 10 |
115.29 |
SOLD 30 spy puts 19JUN10 116 @ 4.39 |
44.50 |
13125.50 |
1831.00 |
44866.50 |
| May 11 10 |
115.85 |
BOUGHT 20 spy puts 19JUN10 116 @ 3.93
Comments: The Oscillator does not show this as overbought or
oversold. My instincts are telling me we could be moving
lower shortly. I would have expected a lower move following
the poor performance out of Europe and Asia overnight. I
could be quite wrong here though as the S&P has always been
an independent market as far as its "mood" is concerned. |
32.00 |
(7892.00) |
|
|
| May 11 10 |
115.96 |
SOLD 20 spy puts 19JUN10 116 @ 3.82
Comments: The market continues to try to churn higher. I
have closed my spy puts for a small loss and will wait for the
oscillator to show an overbought condition. |
32.00 |
7608.00 |
(284.00) |
44582.50 |
| May 11 10 |
116.07 |
BOUGHT 20 spy puts 19JUN10 116 @ 3.81 |
32.00 |
(7652.00) |
|
|
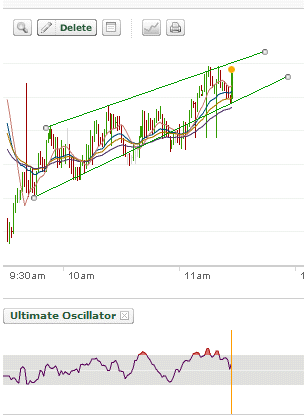
| May 11 10 |
115.95 |
SOLD 20 spy puts 19JUN10 116 @ 3.79
Comments: I have included a chart below which shows the SPY
since opening. The trend is up and while I remain bearish
for the next few days or weeks, today it looks like the
market wants to push higher. I will watch during the day and
try to pick a point to re-enter by put buying.
 |
32.00 |
7548.00 |
(104.00) |
44478.50 |
| May 11 10 |
117.16 |
Bought 20 spy puts 19JUN10 116 @ 3.22 |
32.00 |
(6472.00) |
|
|
| May 11 10 |
115.95 |
Sold 20 spy puts 19JUN10 116 @ 3.95 |
32.00 |
7868.00 |
1396.00 |
45874.50 |
| May 12 10 |
117.01 |
BOUGHT 20 spy puts 19JUN10 116 @ 3.00
Comments: This rally continues to struggle and I believe
will pull back. I have my sell order in at 3.50 but I am
away from my home today so I have a stop loss in at 3.25. I
will be monitoring my positions with my new iphone! |
32.00 |
(6032.00) |
|
|
| May 12 10 |
116.55 |
SOLD 20 spy puts 19JUN10 116 @ 3.25:
Comments: To explain this trade a little further. I bought
my spy puts where the blue arrow with X is. I watched my trade
for a short while but I had to go out. By then the SPY spy
puts
were down to around 3.35 near the RED X on the chart below,
but the advances versus decliners showed a definite
strength. As I was not going to be back in for the rest of
the day I put in my stop loss at 3.25 and my sell at 3.50,
which was just above the morning's low of 3.60. Shortly
after leaving it appears I was sold out as the SPY began to
recover. By the time of the fill it seems the SPY was around
116.55 when I was filled.
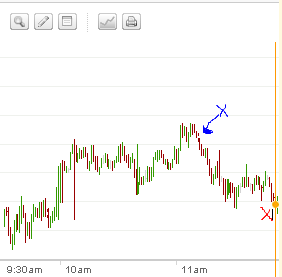
This is an excellent way to trade the SPY when I cannot
watch the trade all day. This is covered
in my section below on how I use to trade the SPY when I was
working during the day. |
32.00 |
6468.00 |
436.00 |
46310.50 |
| May 18 10 |
114.14 |
Bought 30 contracts 19JUN10 spy puts 114 @
3.40 |
44.50 |
(10244.50) |
|
|
| May 18 10 |
112.77 |
Sold 30 contracts 19JUN10 spy puts 114 @
4.39 |
44.50 |
13125.50 |
2881.00 |
49191.50 |
| May 19 10 |
112.48 |
Bought 30 contracts 19JUN10 spy puts 112 @
3.77 |
44.50 |
(11354.50) |
|
|
| May 19 10 |
110.72 |
Sold 30 contracts 19JUN10 spy puts 112 @
4.61 |
44.50 |
13785.50 |
2431.00 |
51622.50 |
| May 20 10 |
109.33 |
Bought 30 contracts 19JUN10 spy puts 109 @
4.33 |
44.50 |
(13034.50) |
|
|
| May 20 10 |
108.68 |
Sold 30 contracts 19JUN10 spy puts 109 @
4.82 |
44.50 |
14415.50 |
1381.00 |
53003.50 |
| Jun 4 10 |
109.00 |
Bought 20 contracts 17JUL10 spy puts 109 @
4.27
Comments: I moved to the Jul put just in case this morning's
big gap down is just an overreaction. It will give me long
time ro recover should the market pull higher. |
32.00 |
(8572.00) |
|
|
| Jun 4 10 |
106.80 |
Sold 20 Contracts 17JUL10 spy puts 109 @
5.22 |
32.00 |
10408.00 |
1836.00 |
54839.50 |
| Jun 7 10 |
106.85 |
BOUGHT 20 CONTRACTS 17JUL10 106 spy
puts @
4.08 |
32.00 |
(8192.00) |
|
|
| Jun 8 10 |
105.08 |
SOLD 20 CONTRACTS 17JUL10 106 spy puts @
4.88 |
32.00 |
9728.00 |
1536.00 |
56375.50 |
| Jun 23 10 |
109.10 |
Bought 20 CONTRACTS 17JUL10 109 spy
puts @
2.57 |
32.00 |
(5172.00) |
|
|
| Jun 24 10 |
107.58 |
SOLD 20 CONTRACTS 17JUL10 109 spy puts @
3.46 |
32.00 |
6888.00 |
1716.00 |
58091.50 |
| Jun 24 10 |
108.35 |
Bought 20 CONTRACTS 17JUL 108 spy puts @
2.44
Comments: Here we are right at 2:00 PM and the market has
tried a rally. Easy decision to buy the spy puts here. |
32.00 |
(4912.00) |
|
|
| Jun 29 10 |
103.75 |
Sold 20 CONTRACTS 17JUL 108 spy puts @
5.08
Comments: This was an easy sell. As soon as the SPY moved
below 104.00 I just waited and then put in my offer to sell
at 5.00 and then moved it to 5.05 then 5.10 but I was taken
out at 5.08. I sold primarily as I believe after so much
selling there is bound to be a bounce and I can buy back the
spy puts. Remember my goal is to build up my cash cushion and so
far it is working out very well. |
32.00 |
10128.00 |
5216.00 |
63307.50 |
| Aug 12 10 |
108.75 |
Bought 5 CONTRACTS 18SEP10 109 spy
puts @ 3.10 |
13.25 |
(1563.25) |
|
|
| Aug 12 10 |
108.90 |
Bought 5 CONTRACTS 18SEP10 109 spy
puts @ 3.00 |
13.25 |
(1513.25) |
|
|
| Aug 12 10 |
COMMENTS: On today’s
bounce I bought twice into the Spy Sep18 108 spy puts. There are
just two things that might tell me that the market is not
going to sell off much in the near term – 1) The VIX is not
signaling a major selloff coming and 2) Just about everyone
is bearish and the market rarely does what everyone
believes. Nonetheless sentiment is so bad we could see more
selling than anyone expects.
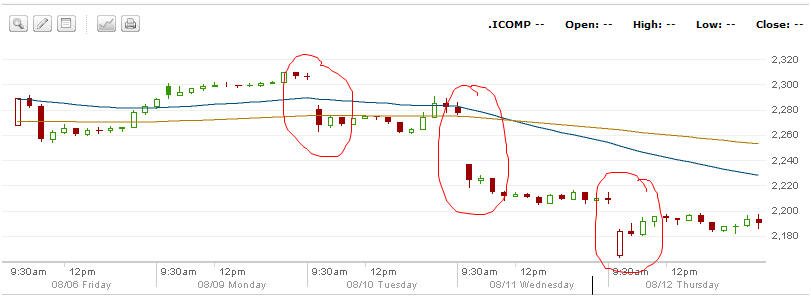
On the other hand the Nasdaq looks terrible. Look at the
chart above. 3 gaps lower on each successive day as
Technology stocks are badly hit. The market could climb back
up and close those gaps or this could be the sign of things
to come. I don’t have a clue, but a lot of technical damage
has been done to the market in the past two sessions. While
we may not pull back immediately, I do believe we are
heading lower over the next few weeks. I plan to hold off on
more naked spy puts until I see if the VIX moves higher. I will
though add to my SPY spy puts on any rally higher from today’s
lows. |
| Aug 17 10 |
109.10 |
SOLD 10 CONTRACTS 18SEP10 109 spy puts @
2.95 |
19.50 |
2930.50 |
(146.00) |
63161.50 |
| Aug 17 10 |
110.20 |
BOUGHT 10 PUT CONTRACTS 18SEP10 109
spy puts @ 2.55 |
19.50 |
(2569.50) |
|
|
| Aug 18 10 |
109.10 |
SOLD 10 PUT CONTRACTS 18SEP10 109 spy
puts
@ 3.05
Comments: This was an easy sell. With yesterday's big move
up I assumed the market could open down, but a one day rally
will definitely de followed by more upside and this is
options week so I would assume we would move higher this
week. I will buy back in on any sign of weakness. |
19.50 |
3030.50 |
461.00 |
63202.50 |
| Aug 19 10 |
108.94 |
BOUGHT 10 PUT CONTRACTS 18SEP10 109
spy puts @ 3.00 |
19.50 |
(3019.50) |
|
|
| Aug 19 10 |
107.65 |
SOLD 10 spy puts CONTRACTS 18SEP10 109
spy puts @ 3.83 |
19.50 |
3810.50 |
791.00 |
63993.50 |
|
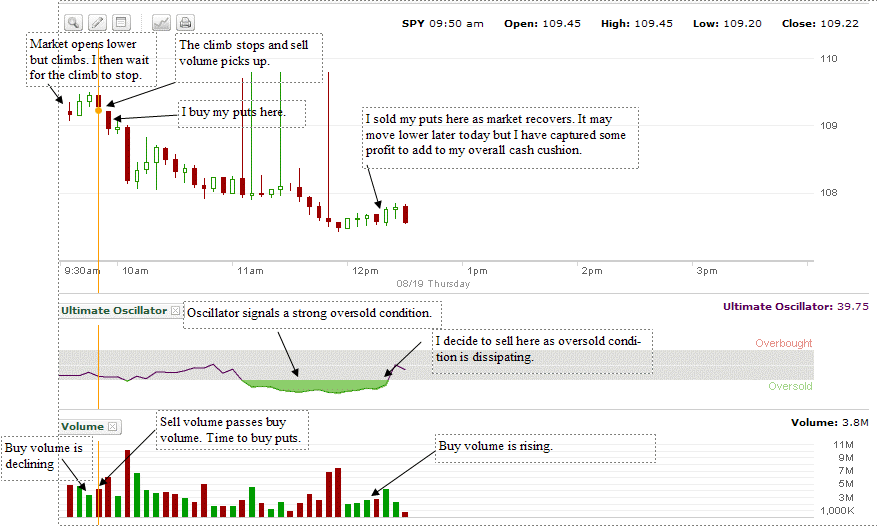
Aug 19 10 - Quick overview. I had a
few emails just before open this morning asking me about the
market ( as the jobs numbers continue to look bad and
futures were down ) and how to judge buying spy spy puts for
trading. While I have a lot of the details below on this
page, nonetheless, here is a look at my trade so far today.
I have put a yellow line where I could see the market under
stress. At that point the SPY was at 109.20. A few minutes
later I bought my spy puts. By then the market had fallen to
108.94. Then look to the volume and the oscillator. The
Oscillator shows oversold within a little over an hour later
and the volume began to pick up. I sold my spy puts after 12:00
when the market began to recover from the oversold
condition. We could move lower from here, but I have brought
in some profit and that's what matters. If options didn't
expire tomorrow I would have hold my spy puts longer, but most
options expiry days can provide unexpected results. It is
important to remember that in my opinion it is impossible to
pick tops and bottoms and get the "ultimate" return. I look
to add small gains to my overall spy put cash cushion which
little by little will build protection long term for the
risk I have taken with my equities. Other traders will buy
spy spy puts on any sign of weakness and hold them over a period
of weeks and months as insurance against a steep decline. I
am looking for "daily insurance" or insurance for just a few
days. As I build my profit I can afford to be wrong
sometimes when buying and selling the spy puts, but I have built
a cash cushion that I hope will grow to eventually protect
against a major decline should that occur. Because I do
short term trading of the spy spy puts, this means that should
the market fall drastically I will probably not be as well
protected as someone holding spy puts long term. However I look
to my cash cushion to help me in the event that happens and
I am not holding spy spy puts all the way down, but buy and
selling short term.
 |
| Aug 25 2010 |
105.01 |
Bought 10 PUT CONTRACTS 18SEP10
$105.00 @ 2.90 |
19.50 |
(2919.50) |
|
|
| Aug 26 2010 |
106.25 |
Bought 5 PUT CONTRACTS 18SEP10 $105.00
@ 2.11 |
13.25 |
(1068.25) |
|
|
| Aug 27 2010 |
105.17 |
Sold 15 PUT CONTRACTS 18SEP10 $105.00
@ 2.72 |
25.75 |
4054.25 |
66.50 |
64060.00 |
| Sep 2 2010 |
108.65 |
Bought 10 CALL CONTRACTS 30SEP10 $109
@ 2.25
COMMENTS: I put together this straddle for one day only as
tomorrow the jobs numbers are released. While I am expecting
neutral to slightly better numbers, it could also be a
surprise. I have a large cash cushion and as such I can
afford to be wrong. |
19.50 |
(2269.50) |
|
|
| Sep 2 2010 |
109.25 |
Bought 10 PUT CONTRACTS 30SEP10 $109 @
2.40 |
19.50 |
(2419.50) |
|
|
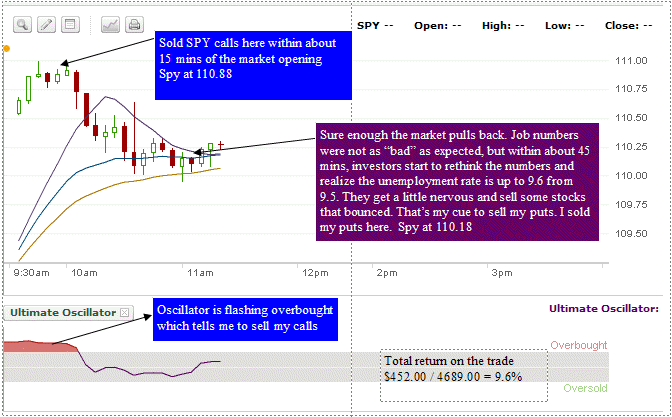
| Sep 3 2010 |
110.88 |
Sold 10 CALL CONTRACTS 30SEP10 $109 @
3.10 |
19.50 |
3080.50 |
|
|
| Sep 3 2010 |
110.18 |
Sold 10 PUT CONTRACTS 30SEP10 $109.00
@ 2.08
COMMENTS: This is my one day trade to take advantage of the
jobs numbers. At the open the market shot up with the news
that "fewer jobs were lost than expected". I thought this
was interesting as you would believe that what the market
would really like to see is jobs added to the marketplace,
but the market was poised for terrible news and it wasn't as
bad as expect. I sold my calls about 15 mins into the open
and my spy puts around 11:10 AM. I have included below a chart
to show the trade for the day. |
19.50 |
2060.50 |
452.00 |
64512.00 |
Sep 3 2010:
Trade Chart |
 |
|
| Sep 22 2010 |
114.12 |
Bought 10 spy puts 20Nov10 $114.00 @
3.69 |
19.50 |
(3709.50) |
|
|
| Sep 28 2010 |
113.27 |
Sold 10 spy puts 20Nov10 $114.00 @ 4.00 |
19.50 |
3980.50 |
271.00 |
64783.00 |
| Oct 19 2010 |
116.73 |
Bought 10 spy puts 31DEC10 $117.00 @
4.60 |
19.50 |
(4619.50) |
|
|
| Oct 21 2010 |
118.98 |
Bought 10 spy puts 31DEC10 $119.00 @ 4.21 |
19.50 |
(4229.50) |
|
|
| Oct 21 2010 |
117.66 |
Sold 10 spy puts 21 DEC10 $119 @ 4.92 |
19.50 |
4900.50 |
671.00 |
65454.00 |
| Oct 21 2010 |
117.66 |
Sold 10 spy puts 31DEC10 $117.00 @ 4.21 |
19.50 |
4190.50 |
(429.00) |
65025.00 |
| Oct 28 2010 |
119.00 |
Bought 10 spy puts 18DEC10 $119.00 @ 3.68 |
19.50 |
(3699.50) |
|
|
| Nov 3 2010 |
119.85 |
STOPPED OUT 18DEC10 10 spy puts @ 2.85 |
19.50 |
2830.50 |
(869.00) |
64156.00 |
| Nov 12 2010 |
120.93 |
Bought 10 spy puts 31DEC10 $120 @ 2.97 |
19.50 |
(2989.50) |
|
|
| Nov 12 2010 |
119.77 |
Sold 5 spy puts 31 DEC10 $120 @ 3.67 |
13.25 |
1821.75 |
|
|
| Nov 12 2010 |
120.10 |
Sold 5 spy puts 31DEC10 $120 @ 3.35 |
13.25 |
1661.75 |
494.00 |
64650.00 |
| Nov 16 2010 |
119.88 |
Bought 20 spy puts 31DEC10 $119 @ $3.68 |
32.00 |
(7392.00) |
|
|
| Nov 16 2010 |
117.89 |
Sold 10 spy puts 31DEC10 $119 @ 4.10 |
19.50 |
4080.50 |
|
|
| Nov 16 2010 |
118.12 |
Sold 10 spy puts 31DEC10 $119 @ 4.09 (Did
this one right at the close). If there is a bounce up
tomorrow, I will consider repurchasing spy puts. |
19.50 |
4070.50 |
759.00 |
65409.00 |
|
|
|
|
|
|
|
|