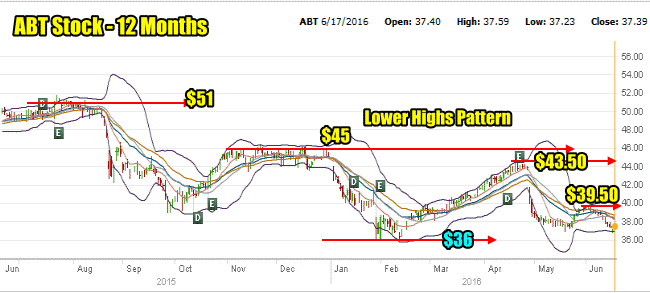
Abbott Labs Stock continues to trade near its 52 week low. The stock is still under pressure. The low for the past 12 months has been $36.00 which was set in Feb 2016.
Abbott Labs Stock – 12 Month Daily Chart
The chart for the past 12 months shows the stock remaining in a declining pattern of lower highs. Closing on Friday at $37.39, the stock is down 27% over the past 6 months which places the stock in a bear pattern.

ABT Stock Lower Highs Pattern – June 17 2016
St Jude Purchase Dropped Abbott Labs Stock
Since agreeing to purchase St Jude Medical for $25 billion back in late April 2016, the stock has been in a declining pattern.
25% Return To Date
Despite the decline in Abbott Labs Stock over the past 12 months, my return is up 25% since January 2016. The latest trades are interesting for members to review in the trade table for Abbott Labs Stock.
On May 10, naked puts ended up in the money and had to be rolled lower as the stock collapsed on the acquisition news. That roll-down ended on Friday with the trade ending out of the money despite the stock closing down at $37.39. I was using the Weekly Wanderer Strategy to pinpoint the put and call strikes to sell and it has done a marvelous job of picking the right positions to rescue the trade.
A second trade had shares assigned on May 20 and members can view the trade done again on Friday with covered calls as I continue to generate more income while the stock attempts to recover. Members can review all the trades in Abbott Labs Stock to see how trades are being managed and kept profitable despite the downturn in the stock…..The rest of this Abbott Labs Stock update is for FullyInformed Members.
Abbott Labs Stock (ABT) Trades for 2016 Update
FullyInformed Members can review the latest Abbott Labs Stock trades update for 2016 directly through this link or they can sign in to the full members site here. Non-members can join here or read about the benefits of being a member.
Disclaimer: There are risks involved in all investment strategies and investors can and do lose capital. Trade at your own risk. Stocks, options and investing are risky and can result in considerable losses. None of the strategies, stocks or information discussed and presented are financial or trading advice or recommendations. Everything presented and discussed are the author’s own trade ideas and opinions which the author may or may not enter into. The author assumes no liability for topics, ideas, errors, omissions, content and external links and trades done or not done. The author may or may not enter the trades mentioned. Some positions in mentioned stocks may already be held or are being adjusted.
Abbott Labs Stock Internal Links
Review Abbott Labs Stock Trades for 2016
Review Abbott Labs Stock Trades For 2015
Review investing strategy articles about Abbott Labs Stock
Abbott Labs External Links
Review Investor Relations for Abbot Labs Stock
Abbott Labs Stock Dividend History
Abbott Labs Stock Dividend Reinvestment Program
Review Portfolios:
Review All Portfolios for US Stocks
Review All Portfolios for Canada Stocks
Review All Retirement Portfolios
SELECT TO REVIEW ALL MY STOCKS

