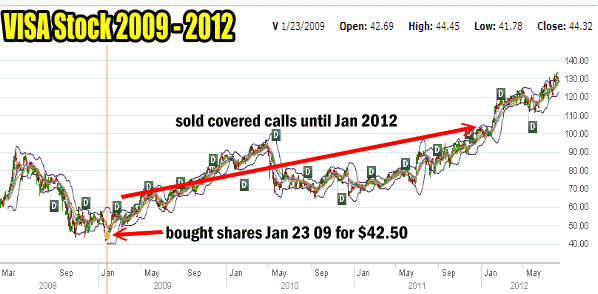
VISA stock has been in my portfolio since 2009. It trades on New York and its symbol is V Stock. When Visa Stock first went public I felt the stock was undervalued at its introductory price but like most retail investors it was next to impossible to get more than a few hundred shares of Visa Stock. I bought 200 shares and held the shares, selling covered calls until January 2012 when I was exercised out at $100.00. Throughout this period I also stayed with a strategy of Put Selling the dips on VISA Stock.
Over the past 3 years there have been plenty of dips in the stock for Put Selling opportunity. In January 2009, the bear market pushed VISA Stock to $41.78 and I bought 500 shares at $42.50. From that point forward I sold out of the money covered calls until January 2012 when I was exercised out of those shares for $100.00 along with the original 200 shares I had got at the IPO.
Selling covered calls on VISA Stock was straight forward. I stayed a couple of months away and always far out of the money. I basically just wanted a little extra income on top of the small dividend while waiting for the stock to appreciate. At $100.00 though I felt it was enough to unload the shares and put the additional capital to work in Put Selling the stock.
Visa Stock Chart

I sold covered calls on VISA Stock after buying them in the 2009 market meltdown.
Put Selling Into September on VISA Stock
This then brings me to the latest Put Selling trade on VISA Stock. I have been Put Selling the Sept $120 put strike on VISA stock. Put Selling against Visa Stock has been fairly simply throughout the past 3 years and it has continued again this year. The dips in VISA stock have made Put Selling easier because the dips always see the stock recover and then try to push a bit higher. This movement in the stock is basically back filling which is what builds support. I then do my Put Selling at that support level.
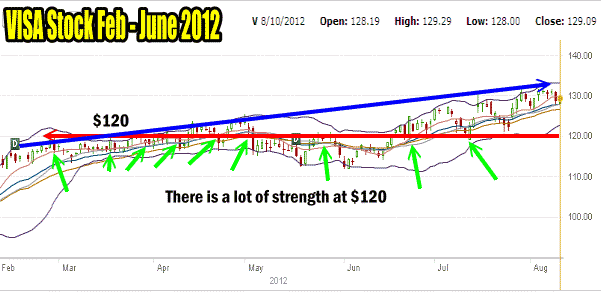
If you look at the 6 month Visa Stock below you can see this back filling over the past 6 months. The general stock direction has been up as marked by the blue arrow, but the back filling is what I am following for Put Selling. I have marked in green arrows the number of times Visa Stock has pulled back and recovered to the $120 level over the past 6 months. It took quite a few months for the stock to get enough strength from buyers to finally push higher. However the recent pullback from the most recent all time intra-day high on Aug 6 of $132.68 again has provided another dip in the stock.

The 6 month Visa Stock chart shows this back filling as the stock continued to build strength around the $120 level.
On August 9 I sold naked puts into September at the $120 strike. Overall I only sold 5 naked puts on August 9 as I am already holding 5 $120 naked puts for September from August 2. This leaves me open to more Put Selling should Visa stock pull back over the next couple of weeks. If it should reach as low as $122 this will make the September $120 naked puts quite expensive and very good for Put Selling.
Buying To Close Naked Puts Early
On August 9 I also bought to close my August $110, $115 and $120 naked put contracts. The strategy is to keep my capital working as much as possible. By buying to close with just a little over a week before August expiry, I can apply the capital into September for additional premium, just in case the stock does not pullback further. The August naked puts that were closed cost .04, .05 and .10 cents to close. These amounts are small when an investor realizes they can capture additional premium by closing for pennies and selling into the next month when a stock is declining.
If Visa Stock was rising, making Put Selling into the next month less profitable, then there would be little need to close the August puts early. However with the stock falling, closing for pennies in the closest month to sell for additional premium in the next month at the same strike is definitely worth while.

