
Put Selling Yum Stock since 2009 has often seen my average capital in use somewhere between $65,000 and $100,000 throughout 2013. The profits earned since 2009 are now at $67,700.00 which means when I am selling 10 puts at the $67.50 valuation the capital to pay for any possible assignment is actually profits I have earned. This is the power of investing through selling options and a handful of stock trades. I always enjoy when I have earned enough in a stock through Put Selling to actually pay for the stock if assigned.
Following the recent collapse of YUM Stock I have adjusted my strategy somewhat to continue to earn very good profits to close out the year.
Oct 18 2013 – Trades and Options Expiry
Oct 9 Leap Puts Sold
When YUM Stock collapsed on October 9 I started into my Put Selling through selling leap puts out to January 2015. I picked the $62.50 put strike because it is sitting at a perfect support point in the stock and paid $6.67 or roughly 10.6%. I have no intention of holding it into January 2015. Instead I will either close it or roll it sometime in 2014.
Oct 10 – Puts Sold and Stock bought
The following day Oct 10 you can see in the chart below that YUM Stock put in a higher low and I sold puts for Oct 19 expiry at the $67.50 put strike which I closed on Friday.
Selling the puts on Oct 10 was an easy choice as soon as I saw the stock fail to break the low of Oct 9. If the stock had continued lower I would not have sold puts or bought stock.
Since the stock was obviously looking to hold support around the $67.00 level I felt the $67.50 puts were excellent for selling since they expired in just a few trading days and I expected any bounce back would reach support at $67.50.
Because this was a short trade and I did not expect to see the puts expire, I sold 10 puts at $67.50 which is 5 more than the usual number. This is because I assumed at the outset I would have to buy to close the $67.50 puts and I wanted to earn a higher dollar amount primarily because I was unsure how much I might have to pay to buy them back.
Oct 10 – Stock Bought
On the same day I bought stock at $65.69 for a bounce back up. Once the stock had put in a higher low which you can see in the chart below, it was obvious that the stock would bounce higher. How high is a guess but I was expecting it would easily move back to support at $67.50. I put in my sell at $67.50. On Thursday I was almost taken but YUM Stock ended that day at $67.48. But on Friday the stock pushed above $67.50 and my shares were sold.
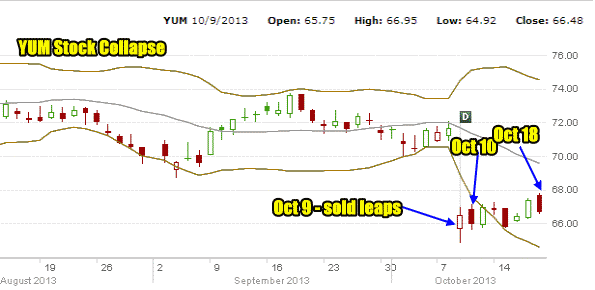
Oct 18 – Options Bought and Closed
At the same time as my stock was sold, I bought and closed the Oct 19 $67.50 puts which I had sold on Oct 10. When I had sold the puts at $67.50 on Oct 10, I earned $1.93. With that much earned it always makes sense to buy to close as soon as possible on expiration day. With the stock just above $67.50 it made sense to close for 25 cents.
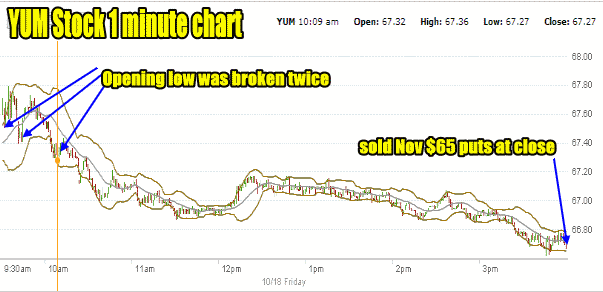
By 10:00 AM you can see in the 1 minute intraday chart below that the stock had twice tried to break through $67.50 and twice had seen two lows, Both of these were lower than the opening low. As well the 10:00 AM low was lower than the 9:45 low. This was my signal that I should watch for a chance to sell the November puts. I focused on the $65 put strike as my goal but wanted at least 70 cents. I got 70 cents right at the close of the day.
End Of The YUM Stock Bounce?
Did Friday’s drop back in YUM stock mark the end of the bounce back from the extreme oversold condition after the collapse on Oct 9 2013? Let’s take a look at YUM Stock technical analysis to see what if anything they can tell us.
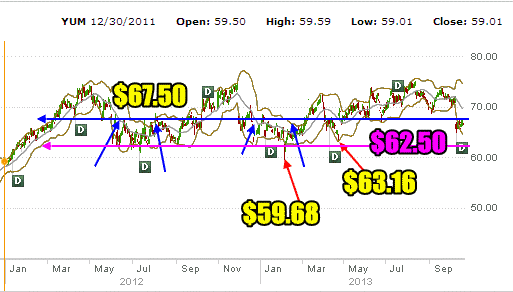
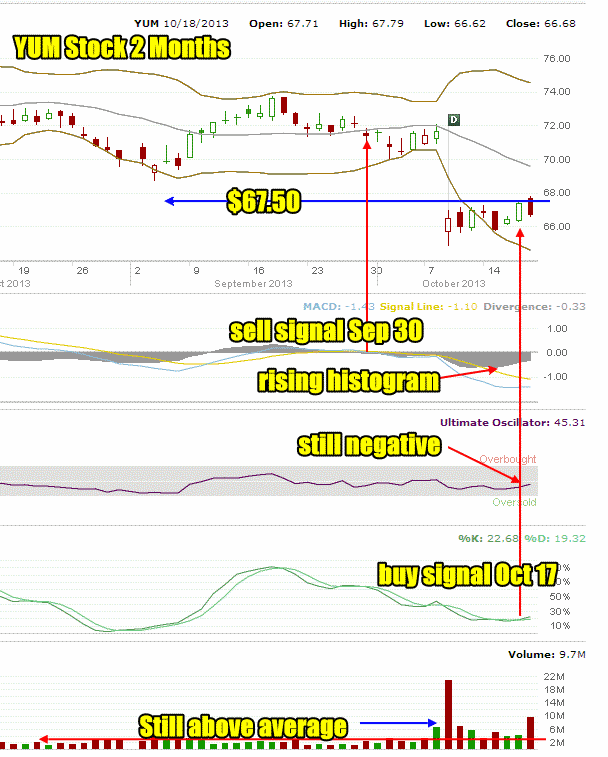
The line of support that I have been Put Selling for much of this year was $67.50. That support goes back into 2012 but you can see in the chart that much of last year and the start of this year saw the stock wander around the $67.50 level. Often $67.50 acted as resistance and indeed on Friday that is exactly what happened as the stock moved higher. I have marked in blue arrows various times last year and at the start of this year when the $67.50 value was resistance.
Once the stock reached $67.50 on Frdiay, investors started taking profits simply because they know the same information I do, that $67.50 which was support is now resistance. It’s a good place to take profits.
Stronger support lies around $62.50. If the stock cannot turn back up and capture and hold $67.50, then it has a good chance to fall back to $62.50. That means the $65 put will have excellent premiums because YUM Stock may indeed set up a new trading pattern between support at $62.50 and resistance around $67.50. You can see why I sold the $62.50 puts on Oct 9 and why on Friday I sold the $65 puts for November. I may be earlier with the $65 puts for Nov 16 expiry but I sold just 5 contracts to start and will sell more if the stock falls back toward the $62.50 level.
There have been two extreme lows this year. The first in February at $59.68 and the second in April at $63.16. Both of these were excellent points for Put Selling and stock buying. This may happen again shortly.
Technical Outlook For YUM Stock
Meanwhile technically YUM Stock looks stronger than investors might at first glance think. Back on Sept 30 MACD issued a sell signal on YUM Stock. I have marked it in the chart below. Since then MACD has stayed negative and at present is quite negative although there is a rising MACD histogram which may be suggesting the selling has climaxed and the recovery is underway. The Ultimate Oscillator is still negative although these past few trading days since the collapse has seen a fairly steady rise.
The Slow Stochastic issued a buy signal on Thursday Oct 17 on YUM Stock. That my be negated now by the action on Friday. It will take Monday’s Slow Stochastic reading to know whether the Oct 17 buy signal is confirmed or not. Volume is still above average although the heavier selling has died down. Friday though was overwhelming bearish.
YUM Stock Outlook and Strategy
Somehow I cannot see YUM Stock coming back into the past highs in the near-term. However I do think that with the news of the spurt in Chinese GDP, investors may again take heart in YUM Stock’s chances and push the stock back above $70 for a short period. The problem YUM Stock is having in general though is it is overvalued above $70 unless earnings can grow and that has not been happening. This overbought nature is the reason the stock jumps up and then collapses back again. Revenue must increase to support a solid move above $70 that can be held.
Meanwhile at the $67.50 level Yum Stock is fairly valued and at $62.50 or below is is excellent value. Therefore while the technical indicators do not look too bad, the outlook is still negative for the stock. It must grow its earnings overseas to get the stock price back up. I think Friday may mark the end of the recent rally but I do believe any downside will have trouble breaking much below light support at $65. This is exactly why I sold the $65 and $62.50 puts. I am not anticipating picking up any shares through assignment. While I may not believe the rally is still intact I do think YUM Stock could be setting up for a new trading pattern from $62.50 on the low to just above $70 on the top-end.
My strategy is simple. I am selling the three puts strikes, namely $62.50, $65 and $67.50. If YUM Stock does not set up a trading pattern between those strikes then I will roll down by one strike. However I do believe earnings are strong enough to keep the stock above support at $62.50. I do not plan to let any of the puts expire. I will be trading these puts intraday at times during periods of higher volatility. I also plan to buy them back and then resell them again especially on days of big dips.
I think YUM Stock holds exceptional potential still for Put Selling, but if the goal is to never be assigned stock then the $62.50 put strike is the strike to sell in my opinion. If you are like me and think YUM Stock has more potential, then selling the $65.00 or even the $67.50 puts makes even more sense. I am not concerned about YUM Stock collapsing. I have in place a roll down strategy that I have used for over two decades on stocks like YUM.
Yum Stock Internal Links
Yum Stock Members Strategy Articles