Earnings were released by AT&T Stock (T) and the stock fell on April 24 to a low of $36.63. I sold puts on the drop but AT&T stock only partly recovered on Thursday and then moved back to close at $37.04 on Friday. Put Selling has been highly profitable in AT&T Stock since I started in 2011 but the recent weakness caught a lot of investors by surprise. I received a number of emails wondering why I had sold puts on April 24 and asking if I was concerned about AT&T Stock falling lower. Let’s take a look at the earnings to see why investors were dumping the shares of AT&T Stock.
AT&T Stock Earnings
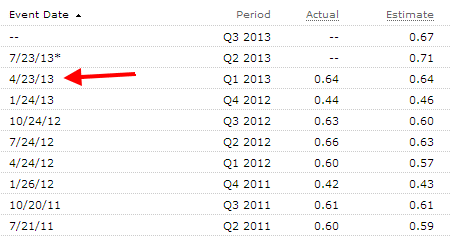
For the quarter AT&T Stock earned .64 cents which met analysts estimates. But investors noted that revenue dropped slightly from the same quarter last year. Gross margins increased but operating margins shrank. Most analysts had expected revenue of $31.74 billion and AT&T brought in $31.36 billion. What also bothered investors was that next quarter’s earnings showed little growth over the previous quarter and next year’s revenue estimate of $129.04 billion did not come in on the high side of expectations.
As you can see in the quarterly earnings chart below, AT&T Stock has a history of not surprising either to the upside or downside with quarterly earnings.

AT&T Stock (T) Earnings
Put Selling AT&T Stock
The drop in AT&T stock back to $37 is, I believe, an opportunity for more Put Selling profits. A few things to note which I have marked in the AT&T Stock daily chart below:
A. AT&T Stock did not break the Lower Bollinger Band when the stock collapsed on Wednesday. The stock has stayed above the Lower Bollinger Band and ran along side the top of the Lower Bollinger Band. Both are strong signals that there are not a lot of sellers at this point. The drop on April 24 may have shaken out a lot of sellers.
B. The $36 put strike is at support which goes back more than a few months and was support from the end of July 2012 to early October 2012.
C. The Fast Stochastic continues to signal that the stock could move lower, but it is also signaling that the stock is heavily oversold and could be set to bounce back.

Put Selling Analysis of AT&T Stock
AT&T Stock 6 Month Chart
If I bring up the 6 month daily chart on AT&T Stock we can see a few other things as well.
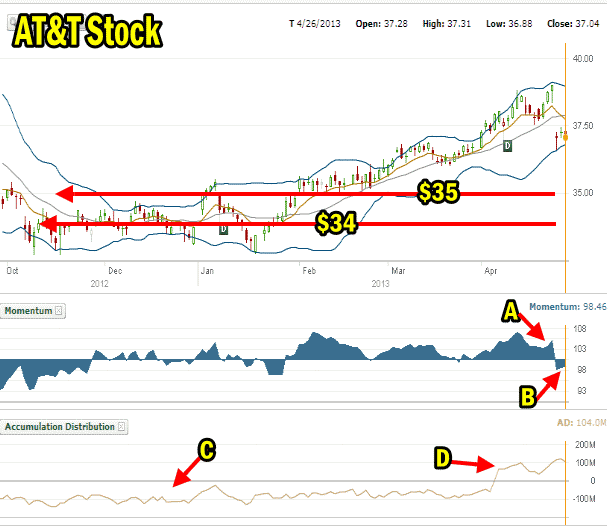
A. On the last push higher in AT&T Stock momentum was already pulling back. You can see at point A that the high on April 23 of $39, the day before the collapse had declining momentum which is almost always a signal that the rally will fail. Therefore on April 24 when the stock plunged on earnings a lot of that plunge was caused by traders who would have seen momentum and wanted to get out of the stock. The drop from $39.00 to $36.63 on April 24 marked a decline of 6% in AT&T Stock.
B. However you can see that despite the 6% drop, the recovery was already underway and by Friday April 26 momentum was already during back up, although still negative.
C. On the six month time frame you can see that accumulation / distribution was bias to the distribution side. In other words for much of the past 6 months there has been more interest in selling out of the stock than buying into the stock.
D. That changed in early April when the bias changed to accumulation and despite the recent plunge, the stock has stayed in accumulation mode. Often when there is a long period of distribution such as we can see in the chart below, this means a lot of potential sellers have left and the stock can finally move back higher. Like any stock tool, there is never a guarantee but the fact that distribution remains dominant for so many months would have turned over a lot of stock from sellers to buyers which could partly explain the sudden rise in accumulation at the start of April.

AT&T Stock Put Selling strikes - 6 month chart
Put Selling AT&T Stock Strikes
Looking at the 6 month chart above you can see that I plan to trade first the $36 naked puts and if they break, then the $35 and finally the $34. $34 is long-term support in AT&T Stock and could be considered a “line in the sand” marker. This means if $34 should ever break then it would be time to reassess the entire trade to determine what strikes should be used next or whether the capital tied to AT&T Stock should be used elsewhere and Put Selling stop in AT&T Stock.
Put premiums 1 month out remain good when sold on dips in the stock. Placing a “good until end of day” offer to sell slightly out of the asking price may get fills during the day while AT&T Stock fluctuates as it still “calms” down from the big drop last week. I often find I can pick up a few additional cents by simple putting in an offer first thing in the morning and letting it sit just slightly above the early morning ask. Any short drop in the day and I often get a fill.
By having clear goals I know when to roll down my naked puts if necessary and I know when to close all the trades and leave the stock behind. It is through having a plan and knowing what strategies to use that I remain comfortable with Put Selling my stocks, including AT&T Stock.
T Stock (AT&T Stock) Internal Links
Review T Stock Trades For 2013
Review T Stock Trades For 2012
Review T Stock Trades For 2011
Review T Stock Strategy Articles
Review Members Only T Stock Strategy Articles

