Put Selling as regular readers know, is my favorite investment method. While many investors may not consider Put Selling a valid Stock Investment strategy, I have lots of evidence that would argue strongly in favor of Put Selling as not only an income method but also a way to compound earnings monthly, quarterly, semi-annually and annually. The way to grow wealth is through compounding of returns and Put Selling compounds returns quickly.
Market Direction is the single most important factor in investing on the right side of the trend. It is important to have a basic confidence in the market direction to benefit from Put Selling. While I primarily use Put Selling to earn income and sell puts options against stocks that I would own if assigned, my goal is always to avoid assignment until I want to take assignment. You can read this article to learn how Put Selling can provide total control over assignment to understand more about my approach to selling put options.
Yesterday’s comments by ECB President Draghi were written up in my market direction outlook in which I indicated that after four days of selling the market may be ready to bounce, but that overall I did not see a significant change in market direction. In other words good employment numbers would create a bounce. But does this change the overall trend to finally break through the well-defined trading range we have been in since the start of June.
Put Selling Dips
While investor enthusiasm can push stocks beyond normal bounds, eventually stocks move to reasonable valuations. Today’s rally while a good sign, continues to support Put Selling on dips or for those who are trading stocks, not options, buying stocks on dips and selling them on rises.
Market Direction Stuck In Trading Range
The chart below shows the definite pattern of higher highs and higher lows which has been with the stock market since the start of June. This is a good sign that the bulls are still in charge, but it is also an advantage for traders as each dip, marked in a red circle, can be used for Put Selling favored stocks and then closing those puts for very good profits when stocks rise again.

Put Selling The Market Direction Dips
The perfect aspect of selling put options on dips is that by establishing a set group of stocks an investor can set up charts which they can watch for the same pattern to develop as the market pattern above. When the stock pulls back, those of us who enjoy Put Selling can start by selling put options a month out and slightly out of the money. By staying just out of the money, and away from the most recent low, an investor has a better than average chance the stock will follow the market direction which will assist the investor in not being assigned shares, or in a worse case scenario, assist in having to buy back the naked puts and roll them to the next month to avoid assignment.
My YUM Stock trade which I wrote about earlier shows that same pattern and the strategy in use.
Put Selling Favorite Stocks
By staying with large cap, dividend paying blue chips stocks, the pattern can be seen in all my favorite stocks making Put Selling since the start of June straight forward and simple.
Here are some of the stocks I have been Put Selling against since the pattern emerged.
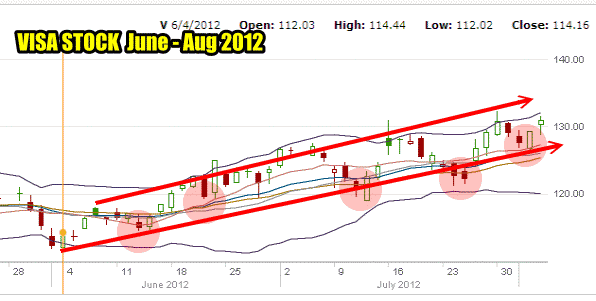
VISA Stock has been truly a terrific performer.

Put Selling Visa Stock from June to Aug 2012
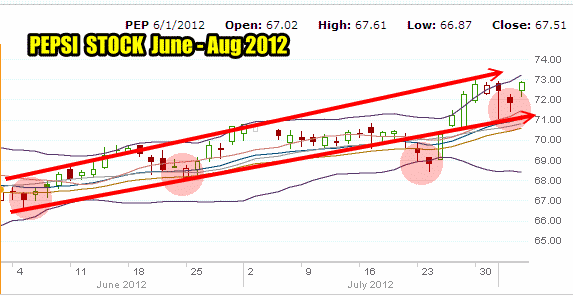
Pepsi Stock has been terrific for my Put Selling since the start of June.

Put Selling Pepsi Stock throughout this same period has also been easy
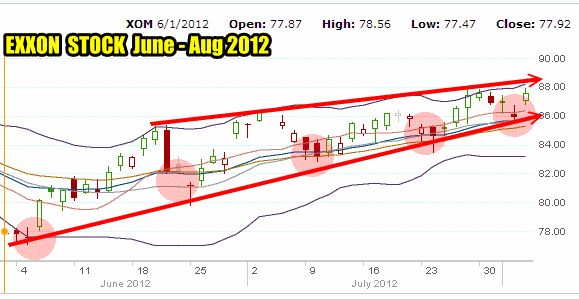
Even XOM Stock which is a commodity stock has stayed to the same pattern despite the constant fluctuation in the price of oil.

XOM Stock has still made Put Selling easy despite fluctuating oil prices.
Put Selling Market Direction Patterns
The strategy is easy. The first dip, marks the first put strike to be considered. The next dip, I can sell the put strike from the previous dip. The third dip I sell the put strike from the second dip and continue to repeat the process.
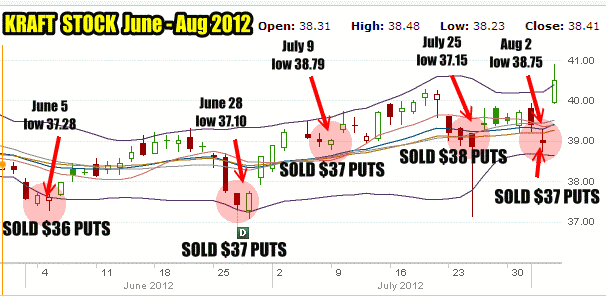
For example, the Kraft Stock price chart below shows the put strikes I have sold since the start of June. Let’s review this simple Put Selling strategy.
June 5 the stock set a low of $37.28. I sold the July $36 puts. Therefore on the next put sell, I will be put selling the $37.00 put strike since the June 5 low was $37.28.
On June 28 the low was $37.10 and I was Put Selling the Aug $37 put options.
On July 8 Kraft stock made a low of $38.79 and since June 28th low was $37.10, I sold August $37 put options again.
On July 25 Kraft stock made a low of $37.15 and since the July 9 low was $38.79, I was put selling the in the money September $38 put options.
Finally on August 2 Kraft stock made a low of $38.75 and as the low on July 25 was $37.15 I sold the September $37 put options.

Put Selling Kraft Stock since the start of June shows the put strikes sold
Put Selling Market Direction Trend Summary
By plotting out my favorite stock charts and matching the trend of the recent market direction I have enjoyed Put Selling profits in this simple strategy on many stocks that have been in my portfolio for years.

