Johnson and Johnson stock is considered by many investors as too boring for trading. What a lot of investors don’t understand is that boring can be profitable. It can also mean less loss of sleep when the stock markets tank. Johnson and Johnson stock symbol is JNJ.
Today is a good example of seizing a put selling opportunity as it develops. A couple of days ago JNJ Stock sold off and I sold a handful of naked puts. Today though the put selling opportunities are excellent as Johnson and Johnson Stock is off almost a full one percent. For other stocks a one percent pullback is nothing, but for Johnson and Johnson stock, one percent is a nice pullback and I took full advantage.
There is a lot to like about this Johnson and Johnson stock put selling trade besides the premiums earned on the naked puts. The market timing technicals I use are all aligned pointing to a bounce soon for the stock which could turn my recent put selling into a short-term trade.
This doesn’t necessarily mean a bounce over the next few trading sessions and indeed Johnson and Johnson stock could pull back further, however next week marks the trading sessions after memorial day and in my records, the week after memorial day has been a solid week for stocks. Next week also marks the end of May and the start of June. While I am aware of the sell in May theory, I am also aware that this is an election year and summers have been kind to investors during summer periods.
As always the advantage to put selling stocks like Johnson and Johnson Stock is that the stock does not have to rise to benefit my sold puts. Just going sideways will erode the put premiums over the next couple of months and increase the likelihood of good profits from this put selling trade.
Johnson and Johnson Stock Put Selling Trades
Today’s put selling trades on JNJ Stock are all in July. On today’s weakness I sold the Johnson and Johnson stock puts July 21 options expiry at the $60 strike for .65 cents and I did put selling at the $62.50 strike for $1.35.
Johnson and Johnson Stock Put Selling Charts
Let’s look at the past one year in Johnson and Johnson Stock. Johnson and Johnson share price history below gives a clear picture why I keep selling the $62.50 and $60 put strikes.

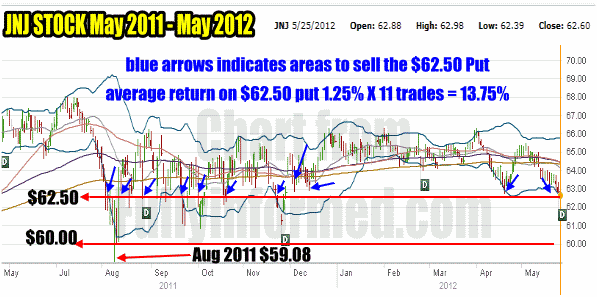
Johnson and Johnson Stock 1 Year Chart showing Put Selling trades at $62.50 for 1 year.
Looking back 1 year on the Johnson and Johnson stock chart you can see that on August 9 2011 the stock set its 52 week low of $59.08. However even on that day Johnson and Johnson stock rallied and closed at $62.20. You can see where I have marked the $60 strike and $62.50 strike for the past year. Johnson and Johnson stock has rarely fallen below the $62.50 strike. Obviously then the $62.50 and $60 make for prime put selling strikes.
During the past 12 months I have sold Johnson and Johnson Stock puts at least 11 times at the $62.50 put and twice at the $60 put strike. The $62.50 puts earned 13.75% over the past 12 months. Somewhat similar to the BMO Stock Pattern Trading article I wrote recently, Johnson and Johnson stock also had its pattern once it entered the period from July to December last year. If the market fails to recover this summer and fall, Johnson and Johnson stock may once more fall into this same pattern making put selling straight forward and highly profitable.
Put Selling And Rolling Strategy
If though the stock should fall below the $60 and $62.50 levels the great aspect of put selling both of these strikes is that should I need to roll these naked puts to avoid being assigned, I have sold puts at the lowest valuations for the past 12 months. This will make rolling either out to other months but at the same strike or in my case, rolling out and down one strike much easier.
For example, should the stock fall to perhaps $57.00 I would roll my July $62.50 naked puts out a few months and down to the $60.00 strike. The $60 naked puts I would roll out and down to $57.50 put strike. When investing through put selling I cannot stress enough the importance of strategy and of having a plan before placing the trades. Once you have a strategy in place and a plan laid out, it really doesn’t matter if my Johnson and Johnson stock put selling trades don’t work out as expected.
Johnson and Johnson Stock Put Selling Strategy
With a plan in place I now know that should the stock fall to the $57.00 range I will roll. It doesn’t matter to me whether there is a month left before July options expiry. The plan dictates what I need to do. As I have used this strategy many times in the past I know that I should not second guess the plan. If I second guess the plan, by perhaps holding on and waiting until the stock fell perhaps to $56.00 and then rolled my put positions out and down, I will not get the same premiums and indeed might end up rolling for a net debit rather than a net credit.
If the stock fell to $57.00 and I roll then and within a couple of weeks the stock recovers, I can buy back my naked puts and close the trades for a profit or I can stay at the lower strikes and roll further out in time. It becomes obvious then that a strategy works when engaged in put selling, whether on Johnson and Johnson stock or any stock. Strategy and Planning are important.
Johnson and Johnson Stock Technical Outlook
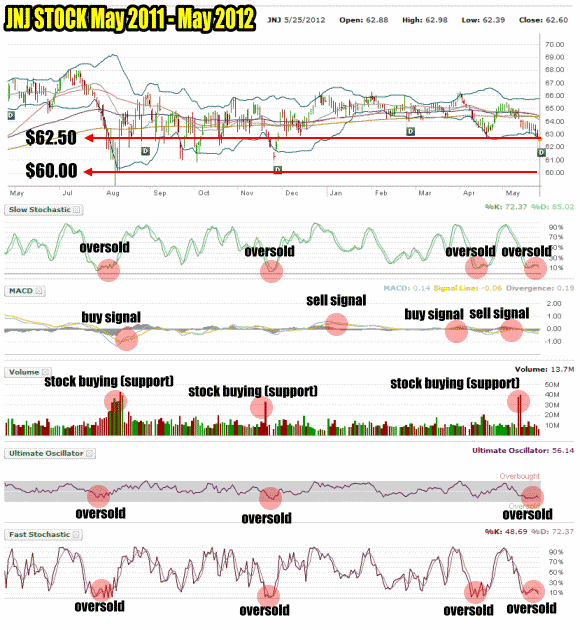
The technicals for JNJ Stock are looking exceptionally well for a possible bounce. Below you can see the technical charting for Johnson and Johnson stock over the past year. You can readily see the put selling opportunities throughout the past 12 months.
I have highlighted in red circles the most important aspects of this market timing chart on Johnson and Johnson Stock.
Slow Stochastic – There have been 4 very strong oversold readings over the past 12 months. We are now into the fourth one. Each one was followed by a decent rebound which should give an opportunity to buy to close the naked puts that I have sold.
MACD – Has given two solid buy and sell signals over the past year. Johnson and Johnson Stock stays in a shallow trading range so MACD is not as valuable a timing tool as the other tools are. Still, MACD has given some excellent signals this year.
VOLUME – As an indicator volume is important. Three times this past year volume has shown that support for this stock lies in the $60 to $62.50 range.
ULTIMATE OSCILLATOR – Again, because Johnson and Johnson Stock is in a shallow range for most of the year, the Ultimate Oscillator does not give extreme oversold and overbought readings. However it is still valuable to check for oversold readings before put selling against the stock.
FAST STOCHASTIC – Unlike slow stochastic, the fast stochastic looks out only a day or two and each oversold reading has resulted in a bounce back for Johnson and Johnson stock.

Put Selling Market Timing Indicators On Johnson and Johnson Stock May 2011 to May 2012
Johnson and Johnson stock may have further to fall and could even retest the $60 support level. Based on the summer to fall 2011 period, Johnson and Johnson stock fell through $62.50 support several times but always returned to it.
However looking at the above market timing Johnson and Johnson Stock Chart, based on the past record, today’s readings of all the technical indicators show that the stock is once more oversold and could bounce back up from here.
Since put option premiums are naturally best at the $62.50 put strike versus the $60 put strike, my strategy is to do more put selling at the $62.50 strike than at $60.00.
Johnson and Johnson Stock Put Selling Summary
Interested investors can select this Johnson and Johnson stock link to visit their investors relations.
Today’s put selling against Johnson and Johnson stock just adds more naked puts to my positions in this excellent stock. JNJ Stock has been a solid performer for better than 12 years in my portfolio and I see nothing presently on the horizon that would see a significant change in the performance or the trading range of Johnson and Johnson stock. Despite this, it is always prudent to engage in put selling by small numbers of contracts any time the stock pulls back as there is ample opportunity and time to sell puts when Johnson and Johnson stock falls. Over the past 12 months, every pullback has provided a number of chances to sell puts on Johnson and Johnson stock which has made put selling in small groups a beneficial strategy since when the stock pulls back further than expected I still have capital available to sell puts for better put selling premiums.

