Johnson and Johnson stock has definitely been on fire. The stock is up from intra-day low of 61.83 on June 12 to an intraday high today of 66.96. This marks a 8.3% rise in Johnson and Johnson stock in just 6 trading sessions. At today’s close of $66.72 Johnson and Johnson stock is overvalued and while it certainly looks like it could move higher, my naked put options premiums are ready to be bought back.
As well based on the Fast Stochastic readings of Johnson and Johnson Stock which flashed a sell signal today, I felt it was best to sell my remaining shares of stock.
Johnson and Johnson Stock Put Options Closed
Today I bought to close my July $62.50 naked puts and my July $60.00 naked puts. By closing my July options now for pennies I am freeing up $92,500.00 of my capital for more put selling opportunities on other stocks. It is important with so many days to expiry, to buy back sold naked puts that can be bought for pennies to release capital for other trade opportunities in either the same stock or other stocks.
Right now Johnson and Johnson Stock is overvalued and not worth writing puts against. But that could change which is why I watch my handful of stocks daily.
When To Sell Johnson and Johnson Stock
While I sold my Johnson and Johnson stock today, I thought a short paragraph on how to decide when to sell stock might assist readers.
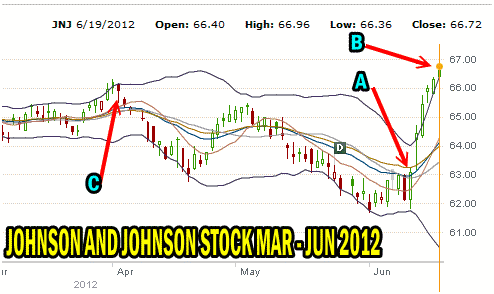
The chart below shows the recent months in Johnson and Johnson stock.
A. Marks the MACD Buy Signal from June 12.
B. Johnson and Johnson stock continues to climb outside of the upper Bollinger band. This will only last a short time and may end tomorrow. An investors could sell their shares in Johnson and Johnson stock today but the stock could move higher. What an investor should be looking for is what “C” shows.
C. This is what investors should be watching for with Johnson and Johnson stock. I won’t be surprised if I see this pattern tomorrow with the stock. As long as a stock if staying to the upper Bollinger band there is no reason to sell. However once it breaks from the upper Bollinger band it could be a sign that the rally is over. There is however, no guarantee that a move away from the upper Bollinger band is the end of the rally. Johnson and Johnson stock could easily trend sideways and then continue to rally higher. However I prefer to sell once the stock pulls away as it did previously as per “C” below.

The above 3 month chart shows the signs to watch for to know when to sell Johnson and Johnson stock
It also never hurts to look at the history of a stock as well. For example, Johnson and Johnson stock has always had a difficult time rising and holding beyond $66.00. This time could be different but I would prefer to sell out and lock in my profit. Then if Johnson and Johnson Stock sets up a new trading pattern I can then reassess my put selling range for the stock. Right now though, I believe that Johnson and Johnson Stock is ahead of itself and will pull back allowing for more put selling opportunities shortly.
Johnson and Johnson Stock Technical Timing Indicators
Here are the reasons I sold my Johnson and Johnson stock today.
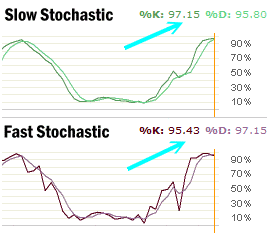
Both the Slow Stochastic and Fast Stochastic technical timing indicators are showing extremely overbought conditions on Johnson and Johnson stock. Indeed the Slow Stochastic is showing %K 97.15 and %D 95.80 which are close readings which normally indicate a change in trend is about to happen.
The Fast Stochastic is already flashing SELL with a reading of %K 95.43 and %D 97.15. This reading is why I sold my shares in JNJ Stock today. I could be early by a day or two but based on the two readings below I believe the rally in Johnson and Johnson stock is about to end for now.

The Slow Stochastic and Fast Stochastic Technical Timing Tools are both showing extremely overbought conditions.
Johnson and Johnson Stock Sold Conclusion
With just the Fast Stochastic reading showing a sell signal, there is no guarantee that selling will start tomorrow. However I have found, to be consistent in my earnings I have to stay consistent with my technical timing tools. Today when I saw the Fast Stochastic signal a sell sign, I felt it was time to lock in my profit. While never a guarantee that the stock will not climb higher, by looking at the history of Johnson and Johnson Stock I can see that at $66.75 the stock is overvalued. Until Johnson and Johnson stock sets up a new range I feel it is always in my best interest to sell my position and turn the cash back into available capital for another trade elsewhere.

