

Hewlett-Packard Stock rose more than 6% after hours following their earnings release for the last quarter. Their revenue for the 4th quarter came in at $29.1 billion, less than the $30 billion a year ago but far higher than estimates which averaged $27.86 billion. This stunned a lot of analysts which is part of the reason the stock jumped 6% after hours. It also could mean it is time to bring out the Bollinger Bands – EMA Strategy from my tool chest to gain better than usual profits from selling options while avoiding stock ownership.
HPQ Stock Earnings
Earnings were anticipated at around $1.00 but came in at 73 cents. Still this was a lot better than the $3.49 loss for the same quarter last year. When HP excludes one time items it would have earned $1.01 which was in line with expectations.
HPQ Stock Forward Looking Earnings Outlook
For the upcoming first quarter, Hewlett-Packard estimates it will earn between 82 to 86 cents a share. This again is in line with estimates from analysts of 85 cents for the upcoming quarter.
HPQ Stock Put Selling Outlook
HPQ Stock is often favored by investors who look to Put Selling for income, since the stock is a low value stock trading in the mid-twenties. It also has enough volatility to make Put Selling against the stock attractive. That said, it is well worth looking at the stock to determine where support levels are, how much support there is at those levels and what type of simple rescue strategy could be used if the stock should turn back down.
Trend in HPQ Stock
The trend in the stock could now be back up with revenue and earnings on track to meet analysts estimates. The company has had a lot of trouble and has experienced two solid collapses in valuations both of which damaged a lot of portfolios. The 1st collapse began in 2007 and the all too familiar pattern of lower highs developed.
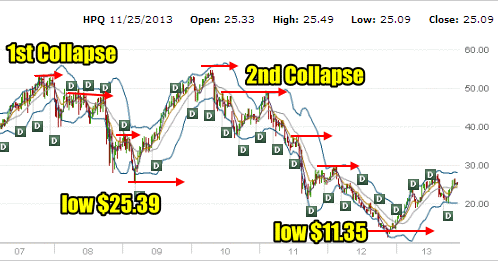
Typical Bear Market Pattern in HPQ Stock
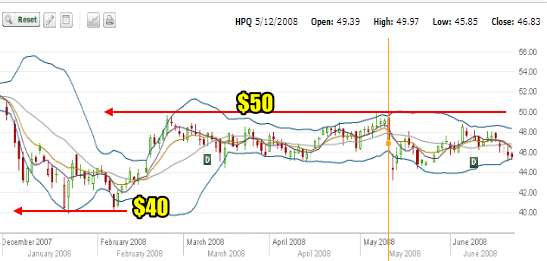
In February 2008 when HPQ Stock fell back to around $40.00 analysts called it “terribly undervalued” . A sharp rally ensued which shot the stock back up to almost $50.00 but each little rally back up in early 2008 kept falling short of the $50.00 valuation. This is typical bear market pattern in a stock as it keeps trying to recover but just can’t. Investors above $50.00 keep dumping their shares each time the stock rallies back up and no new investors can be found to push the stock back above $50. Therefore the stock by June commenced another leg down.
Typical bear rally pattern in a declining stock
2008 to 2009 HPQ Stock Collapse
A final rally in September 2008 shot the stock to $49.20 and then the big plunge was underway. When it ended in march 2009 HPQ Stock was down to $25.39 for a loss of over 50%.
2010 – 2012 Collapse of HPQ Stock
From that low of March 2009 the stock commenced a recovery that by Dec 2009 had the stock back above $50.00 and by April 2010 the stock was above $54. From there a second collapse commenced that may have ended in November 2012 with HPQ Stock down to $11.35 for a loss of 80% in stock value. Since then the stock has tried a recovery and the latest revenue and earnings numbers may indicate a turning point in the stock.
Whether it can reach as high as $50.00 is very questionable but a lot always depends on investor enthusiasm.
A Floor In HPQ Stock
But the most important aspect of the latest earnings and revenue numbers is that it may have placed a floor under how low the stock can be expected to fall in the short-term. This means HPQ Stock could once again become a candidate for Put Selling.
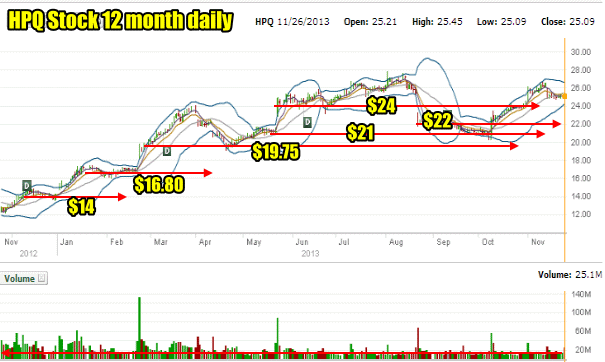
HPQ Stock Support levels 12 Months
If we look at the chart below for the past 12 months we can see a variety of support levels. Some have strong support and others weak support. Let’s take a look.
The strongest support is at $14 and $16.80. Over the past year a lot of investors have bought shares in HPQ Stock at those levels. $19.75 has light support and $21 slightly more support than $19.75.
$22 definitely has less support than any of the other valuations and $24 probably the least support of all. But as you can tell from the volume chart there have been peaks in volume at all the support levels mentioned. Therefore the best way to engage in Put Selling is through following the trend and being aware of the other support levels.
Put Selling The HPQ Stock Trend
Many stocks lend themselves to specific strategies depending on what the investor is hoping to accomplish. As well many stocks also lend themselves to specific strategies depending on price movement and volatility. HPQ Stock throughout the past year has been volatile enough that one of the better strategies has been the Bollinger Bands and the 10 day exponential moving average (EMA).
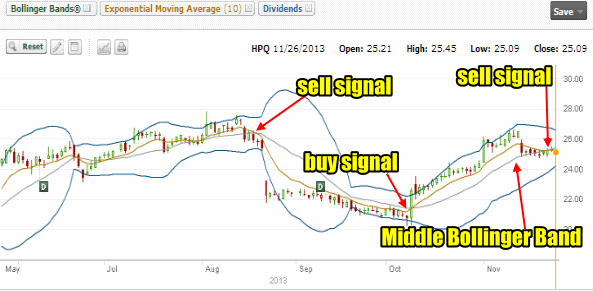
The Bollinger Bands – EMA Strategy
The Bollinger Bands are set for the default 20 period and deviation of 2. That means the Middle Bollinger Band is a 20 period moving average. By adding in the 10 period exponential moving average (EMA) we can at a glance determine if HPQ Stock is rated a buy or a sell.
Sell Signal in HPQ Stock
Whenever the 10 period EMA (yellow line) crosses over and down the 20 period Middle Bollinger Band we can interpret it as a sell signal.
Buy Signal in HPQ Stock
Whenever the 10 period EMA crosses over and up the 20 period Middle Bollinger Band we interpret that signal as a buy signal.
The Middle Bollinger Band Role
Whenever HPQ Stock is above the Middle Bollinger Band we can interpret that as a positive uptrend. In particularly when the stock candlesticks are clinging to the Upper Bollinger Band it is definitely uptrending.
Whenever HPQ Stock is below the Middle Bollinger Band we interpret that as negative or a downtrend. Again, when the stock candlesticks are pushing against the Lower Bollinger Band it is a downtrend.
If we look at the 6 month chart below we can begin to see a pattern where puts can be sold on a buy signal and puts bought and closed on a sell signal. This is because with the buy signal the stock should be moving higher so the likelihood of put options ending up in the money is less. When the sell signal is received it marks the time to buy back the naked puts or stop selling additional puts to avoid any stock being assigned in the event the stock falls back to the put strike sold.
You can understand then that this strategy if applied properly can provide very good returns and attempts to limit the possibility of the stock being assigned in the event the stock pushes lower than the strike sold.
While the Bollinger Bands – EMA strategy seems simple enough there are more mechanics to this strategy for those investors interested in delving deeper into its use. The great advantage to a strategy like this is the ease with which an investor can quickly glance at the chart and immediately know the next move to be made in its use. By applying the Bollinger Bands – EMA strategy properly, an investor can provide superior protection to his capital and continue to earn big returns against a stock like HPQ Stock.
While the Bollinger Bands – EMA strategy does not work on all stocks, it is excellent on stocks like HPQ stock that have volatility and are tough to gauge as to the next possible move in the stock. It is another strategy I keep in my tool chest and bring out at different times throughout the year.
For FullyInformed Members
The rest of this article is for FullyInformed Members as I look at the mechanics of using this strategy to attempt to earn the best premiums possible and the steps needed to avoid stock ownership entirely.
I will be posting that article later this evening to the members section.