As regular readers know, put selling is my favorite investing strategy. But sometimes puts fall into the money and decisions on rolling options strategies have to be made. Those rolling options strategies in the case of my Dupont Stock could include rolling options down, rolling options out, rolling options out and down, rolling options sideways, rolling options and reducing options, or not using any rolling options strategies but instead accepting assignment of stock and turn to selling covered calls.
Dupont Stock is one such case. (Dupont Stock symbol is DD) I like Dupont stock at $44.00 and having sold the Dec 22 2012 $44 naked puts for $1.15 my break-even on the stock is $42.87. This morning the stock set a new 52 low as it hit $42.96. That low placed the valuation close to my break-even but it also gave me the opportunity to consider Put Selling more put strikes and adjusting my Dupont Stock trade.
Lots Of Rolling Options Choices For Dupont Stock
Many investors find making decisions on their trades difficult . When I started investing in the early 1970’s, I found the decision-making process difficult as well. Once I realized the importance of having a plan and having goals I then only had to decide on the strategy I wanted to use.
That exactly what I did this morning when Dupont Stock pulled back. I saw the put options premiums jump and I knew I want to do more Put Selling and adjust my present Dupont Trade. Here are the decisions I made for my Dupont Stock trade today.
Rolling Options Decisions On Dupont Stock
Making a decision as to what should be done next can be perplexing for a lot of investors. When I sold the $44 naked put strike Dupont Stock was above $44.00. But now with the stock having made a new low, what should I consider doing with my Dupont Stock trade?
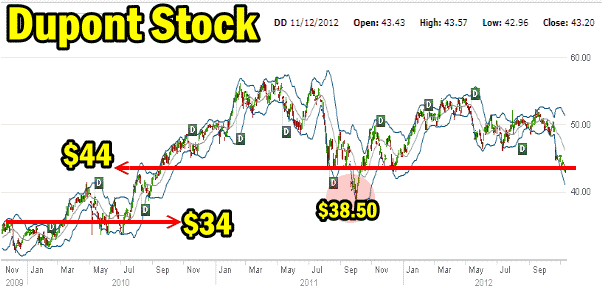
There are a lot of choices for investors who like the company and would own it. The question though is at what price would I own it? Let’s bring up the three-year chart on Dupont Stock. There is a lot of support right around the $43 to $44 level. Once that breaks there is limited support until the stock gets down to $34 where it was in 2010.

Dupont Stock Three Year Chart
Dupont Stock Technical Indicators
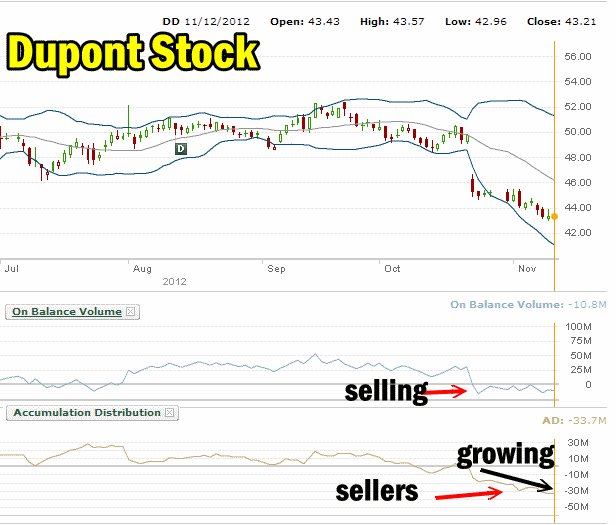
Let’s add in two technical indicators, On Balance Volume and Accumulation/Distribution. The on balance volume indicator is designed to measure the strength of buying and selling pressure. By looking at this indicator an investor can see who is the more aggressive, sellers or buyers. We can see that since the end of July buyers were aggressively buying Dupont Stock but since Oct 23 2012, sellers are the more aggressive. Overall though the selling is not increasing in strength. In other words, there is lots of selling in the stock but the selling is not panicked or overly aggressive.
The Accumulation/Distribution technical indicator is a great tool to see whether buyers or sellers are the more active not aggressive in a stock. We can see that since October 23, sellers are far more active than buyers and they are growing which is only natural since the stock is falling. When a stock falls sellers hold back waiting to see if selling will intensify or if the stock falls lower. When it does, more sellers enter. When the stock sets a new low like Dupont stock did this morning, it brings even more sellers into the stock. This is what is happening with Dupont Stock.

Dupont Stock Share Assessment
Odds of A Technical Bounce In Dupont Stock
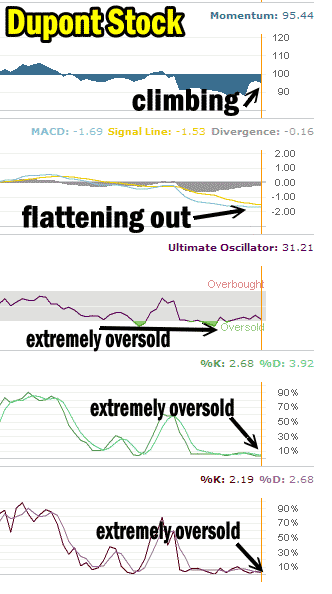
So now we know that there is more selling still going on. It will be hard for Dupont stock to bounce very high with more sellers than buyers. What are they chances of a bounce even if it is technical? For that I look at 5 technical indicators.
Momentum is actually climbing despite the stock pushing lower. That’s a good signal for a possible bounce. MACD is flattening out and not falling further, which is another good sign for a bounce. The Ultimate Oscillator, Fast Stochastic and Slow Stochastic are all extremely oversold, all good signal for a possible bounce.

Technical timing in Dupont Stock
With so many technical indicators showing a possible bounce in Dupont Stock I felt it would be a good time to sell more naked puts at $44 and $43 when Dupont Stock fell below $43 this morning and then close my December $44 naked puts if the stock bounced back in the afternoon. Longer-term, if there is a better bounce this week in the stock I may be able to close my Jan $44 naked puts for additional profits and roll them out even further or lower.
Put Selling More Strikes and Then Rolling Put Options Out Of December $44 Put Strike
This morning I did more Put Selling on the decline in Dupont Stock and sold more naked puts at the following strikes and for the following amounts.
Sold 6 Jan $44 Puts for $2.29 = $1374.00
Sold 4 Dec $43 Puts for $1.47 = $588.00
Commissions = $26.50
Total Income = $1935.50
Then this afternoon as the stock climbed back over $43, I bought and closed my December $44 put strikes for $1.75 = $1769.50 with commissions
Total Income on roll down = $166.00
This increased my total income earned on my Dupont Stock trade to $1302.75 and reduced my cost basis to $42.29.
All About Rolling Options and Cost Basis In Dupont Stock
I wanted to not only get my cost basis lower in Dupont Stock but also push the December $44 naked puts into January but reduce the quantity of naked puts I was holding at $44 and then sell the December $43 puts. By doing this, the January $44 naked puts had enough premium that I could sell just 6 naked puts and then sell the balance of my puts down to the $43 strike in December. If this trade works out and the stock closes near or at the $43 valuation sometime in December I will be able to close the $43 and probably roll then down to perhaps $42 in January.
The goal is to pick up Dupont Stock and the strategy is to earn as much as possible to help pay for the shares in the stock. This adjustment to my Dupont Stock trade meets both of those goals and helps reduce the overall cost by moving from 10 naked puts at $44 to just 6 at $44. Meanwhile by being able to sell the December $43, it shortens the time period before the value will erode, particularly if Dupont Stock can stay above $43.00.
Today’s Dupont Stock trade has reduced my cost basis and the amount of capital needed for this trade. My goal continues to be to raise more cash as the markets stay below the 200 day moving average. Today trades in Dupont Stock helped to do just that.

