I set up a Yahoo forum for those interested in discussing selling stock
options for income including covered
calls, selling naked puts, spreads and other option and stock strategies.
JOIN HERE
DIVIDEND
INVESTMENT STRATEGIES
FOR THE DIVIDEND INVESTOR -
PART 3
INTRODUCTION
In Part 1 I
looked at a dividend
investor who buys a large cap dividend stock
after the announcement of the dividend cut is made. In Part
2 I looked at the long term dividend investor who has been in
the stock for 10 years and rather than being
dismayed at the dividend cut looks at it as a long term
opportunity.
In Part 3 and
Part 4 I will present a number of dividend investing strategies for
those investors who seek to create a dividend stock
portfolio for long term dividend income but wants to reduce
risk as much as possible.
These dividend investment strategies
require a little bit more thinking and strategizing than
simply buying the stock and hoping everything works out. In
my opinion there is no point in chasing the highest dividend
paying stock only to have that stock collapse destroying
your dividend stock portfolio.
No commissions are taken into
account for any of the trades shown here.
A DIFFERENT PERSPECTIVE ON DIVIDEND INVESTING
Wouldn't it be nice if the entire situation could have
been avoided in the first place? How can a long term
dividend investor trying to build a dividend stock portfolio, protect
himself from such a catastrophe as a
dividend cut? While it is impossible to protect from a
dividend cut, a long term investor could have considered
investing in GE stock from a different perspective, which
would mean that his overall share cost basis was low enough
that in the event of a dividend cut, an investor's dividend
stock portfolio is not severely damaged.
What if an
investor took a different approach and applied a different
dividend investment strategy when buying shares in
General Electric stock in the first place.
Instead of just
buying an additional 100 shares every first trading day of
January or whenever there is capital available, the investor instead looked at the previous year
chart of GE Stock and followed it to the most recent previous low
and then put in an order to buy 100 shares at the previous
year's low.
Let's look at how this might change the scenario of a
dividend cut completely.
Below I will show three different dividend
investment strategies which all have
a common theme - buying at the previous year's low.
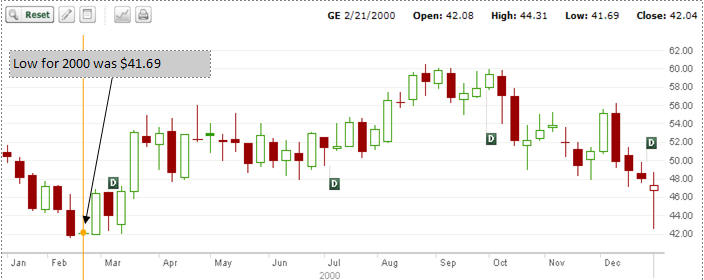
The Dividend Investment Strategy Explained:
This strategy is pretty simple, but it has
significant benefits over the long term. Should an investor want to
start investing in a stock, that investor looks at the
previous year to find the low for that year. For example in
the General Electric Stock Chart below for the year 2000 I
see that the low was $41.69. Therefore this year, 2001, I
put in my order for 100 shares at $41.69. Let's see below
how it works out.
GENERAL ELECTRIC STOCK:
Dividend Investment Strategy 1:
Low of 2000 was $41.69
On MAR 12 2001 the stock reached $41.69. 100 shares are
bought for a cost of $4169.00
Dividend Income Earned To May 27 2011 on these 100 shares is - $852.00
Low of 2001 was $28.50
On JULY 2 2002 the stock reached $28.50. 100 shares
are bought for a cost of
$2850.00
Dividend Income Earned To May 27 2011 on these 100 shares is $750.00
Low of 2002 was $21.40
On FEB 13 2003 the stock reached $21.40. 100 shares are
bought for a cost of $2140.00
Dividend Income Earned To May 27 2011 on these 100 shares is $713.00
Low of 2003 was $21.30
Throughout 2004 the stock stayed above $21.30. The investor does not buy
any shares
Low of 2004 was $28.88
Throughout 2005 the stock stayed above $28.88. The investor
does not buy any shares
Low of 2005 was $32.67
On JAN 25 2006 the stock reached $32.67. 100 shares are
bought for a cost of $3267.00
Dividend Income Earned To May 27 2011 on these 100 shares is $463.00
Low of 2006 was $32.06
Throughout 2007 the stock stayed above $32.06. The investor does not buy
any shares
Low of 2007 was $33.90
On JAN 17 2008 the stock reached $33.90. 100 shares are
bought for a cost of $3390.00
Dividend Income Earned To May 27 2011 on these 100 shares is $276.00
Low of 2008 was $12.58
On JAN 21 2009 the stock reached $12.58. 100 shares are
bought for a cost of $1258.00
Dividends Earned To May 27 2011 on these 100 shares is $121.00
Dividend cut announced Feb 27
On MAR 2 2009 (Day after
announcement) the stock closed at $7.60 . 100 shares are
bought for a cost of $760.00
Dividend Income Earned To May 27 2011 on these 100 shares is $90.00
Low of 2009 was $5.67
Throughout 2010 the stock stayed above $5.67. The investor
does not buy any shares
Low of 2010 was $13.75
To date in 2011 the stock has stayed above $13.75. The
investor does not buy any shares.
Here are the totals:
TOTALS = 700 shares
Total Capital Invested = $17,834.00
Average Share Price = $25.48
Dividend Income Earned since Jan 2 2001= $3935.00
COST BASIS = $17,834.00 invested less $3935.00 in dividends
= $13899.00 / 700 shares = $19.85 per share which is just
above where
the stock is presently trading.
This is a simple strategy which forces buying at low points
and as you can see has the dividend investor at a much lower cost
basis. Therefore when a dividend cut is announced the
investor can look upon it as an opportunity and not sell out
but add to his position.
Dividend Investment Strategy 2:
If an investor desires to place more capital to work every
year then the above strategy can be altered to
accommodate more capital but with an emphasis at still
trying to buy at low points.
For example, based on Strategy 1, in a year where an investor
is NOT buying shares, in the next year that investor could
double their purchase from 100 shares to 200. If another
year passed then the investor would purchase 300 shares.
Based on this strategy here is the outcome:
Low of 2000 was $41.69
On MAR 12 2001 the stock reached $41.69. 100 shares are
bought for a cost of $4169.00
Dividend Income Earned To May 27 2011 on these 100 shares is - $852.00
Low of 2001 was $28.50
On JULY 2 2002 the stock reached $28.50. 100 shares
are bought for a cost of
$2850.00
Dividend Income Earned To May 27 2011 on these 100 shares is $750.00
Low of 2002 was $21.40
On FEB 13 2003 the stock reached $21.40. 100 shares are
bought for a cost of $2140.00
Dividend Income Earned To May 27 2011 on these 100 shares is $713.00
Low of 2003 was $21.30
Throughout 2004 the stock stayed above $21.30. The investor does not buy
any shares
Low of 2004 was $28.88
Throughout 2005 the stock stayed above $28.88. The investor
does not buy any shares
Low of 2005 was $32.67
On JAN 25 2006 the stock reached $32.67. 300 shares are
bought for a cost of $9801.00
Dividend Income Earned To May 27 2011 on these 300 shares is $1389.00
Low of 2006 was $32.06
Throughout 2007 the stock stayed above $32.06. The investor does not buy
any shares
Low of 2007 was $33.90
On JAN 17 2008 the stock reached $33.90. 200 shares are
bought for a cost of $6780.00
Dividend Income Earned To May 27 2011 on these 200 shares is $552.00
Low of 2008 was $12.58
On JAN 21 2009 the stock reached $12.58. 100 shares are
bought for a cost of $1258.00
Dividend Income Earned To May 27 2011 on these 100 shares is $121.00
Dividend cut announced Feb 27
On MAR 2 2009 (Day after
announcement) the stock closed at $7.60 . 100 shares are
bought for a cost of $760.00
Dividend Income Earned To May 27 2011 on these 100 shares is $90.00
Low of 2009 was $5.67
Throughout 2010 the stock stayed above $5.67. The investor
does not buy any shares
Low of 2010 was $13.75
To date in 2011 the stock has stayed above $13.75. The
investor does not buy any shares.
COST BASIS - $27,758.00 invested less $4467.00 in dividends
= $2329.10 / 1000 shares = $23.29 per share.
Strategy 2 increased the amount of capital
invested in General Electric but it also increased the cost
per share. Let's take the same strategy and make one last
change for Strategy 3.
Dividend Investment Strategy 3:
Of all the strategies, I prefer the third
dividend investment strategy, best. This strategy still
purchases additional shares which allows the investor to put
more capital into the stock, but ONLY if there is a new low
for the overall investment. It is easiest to understand
through the example.
Low of 2000 was $41.69
On MAR 12 2001 the stock reached $41.69. 100 shares are
bought for a cost of $4169.00
Dividend Income Earned To May 27 2011 on these 100 shares is - $852.00
*For the very first trade, the low of the investment is
$41.69. This means that I will only buy additional shares is
the next low is lower overall.
Low of 2001 was $28.50
On JULY 2 2002 the stock reached $28.50. 200 shares
are bought for a cost of
$5700.00
Dividend Income Earned To May 27 2011 on these 200 shares is $1500.00
*Now $28.50 is the new low for the overall investment.
Therefore I purchased 100 additional shares at $28.50.
Low of 2002 was $21.40
On FEB 13 2003 the stock reached $21.40. 200 shares are
bought for a cost of $4280.00
Dividend Income Earned To May 27 2011 on these 200 shares is $1426.00
*Since $21.40 is lower than $28.50 I purchased 100 additional
shares
$21.40 becomes the new all time low for my dividend
portfolio.
Low of 2003 was $21.30
Throughout 2004 the stock stayed above $21.30. The investor did not buy
any shares
Low of 2004 was $28.88
Throughout 2005 the stock stayed above $28.88. The investor
did not buy any shares
Low of 2005 was $32.67
On JAN 25 2006 the stock reached $32.67. 100 shares are
bought for a cost of $3267.00
Dividend Income Earned To May 27 2011 on these 100 shares is $463.00
*Since $32.67 is NOT LOWER than the all time low of $21.40 I
only bought 100 shares
Low of 2006 was $32.06
Throughout 2007 the stock stayed above $32.06. The investor did not buy
any shares
Low of 2007 was $33.90
On JAN 17 2008 the stock reached $33.90. 100 shares are
bought for a cost of $3390.00
Dividend Income Earned To May 27 2011 on these 100 shares is $276.00
*Again since $21.40 is the all time low so far in my
investment in GE stock, I only bought 100 shares
Low of 2008 was $12.58
On JAN 21 2009 the stock reached $12.58. 200 shares are
bought for a cost of $2516.00
Dividend Income Earned To May 27 2011 on these 200 shares is $242.00
*Since $12.58 is lower than $21.40, I bought an additional 100 shares
*$12.58 is now the all time low.
Dividend cut announced Feb 27 2009
On MAR 2 2009 (Day after
announcement) the stock closed at $7.60 . 200 shares are
bought for a cost of $1520.00
Dividend Income Earned To May 27 2011 on these 200 shares is $180.00
*Since $7.60 is lower than $12.58, I bought an additional 100 shares
*$7.60 is now the all time low.
Low of 2009 was $5.67
Throughout 2010 the stock stayed above $5.67. The investor
did not buy any shares
Low of 2010 was $13.75
To date in 2011 the stock has stayed above $13.75. The
investor did not buy any shares.
COST BASIS - $24,852.00 invested less $4939.00 in dividends
= $19,913.00 / 1100 shares = $18.10 per share which is below
where the stock is presently trading.
This last dividend investment strategy requires after a collapse such as GE
stock experienced, that the investor eventually picks a new low
stock price target. For myself I would have picked $12.58 the low of
2008 and should the stock not fallen to that level for several
years I would have moved to $21.30, which is the previous low. Based
on $12.58 I still would not have purchased any shares in
2010, as the stock stayed above $12.58.
The advantage of this strategy is that it forces an investor
to purchase more shares of a stock while it is cheaper and
purchase less stock when it is expensive.
You can also see from this strategy how an investor
interested in long term buy and hold dividend investing can create
some protection for himself against buying stock when it is
overvalued and continuing to purchase stock when it is
undervalued.
SUMMARY
Does this type of strategy work for every large cap that
cuts its dividend and collapses? No, but it can help. Stocks
like Citicorp, AIG and others can destroy an investor's
portfolio. Overall this is why I do not believe in buy and
hold. I believe options are a much better choice for
investors. In Part 4 I will look at a put buying strategy on
GE Stock and how I would have applied it over the course of the
last 10 years in General Electric Stock.