I hope you find the information,
concepts, ideas and strategies on my site of value. If you would like to assist me with
the maintenance costs, and time spent keeping my site updated, I
have set up a Paypal account for those who would like to donate.
Thank you in advance. Remember, nothing on my site is financial
advice or recommendations. Investing is risky and losses can be
large. Trade at your own risk.
Read The Disclaimer
The majority of
investors are not stock traders but are are really more
dividend investing or dividend stock investors. Their investments really are
comprised of dividend stocks or dividend stock funds that
make up a dividend
stock portfolio. Dividend stock investing has been popular for decades. Many
dividend investors seek high yield dividend stock and many
others search for the highest paying dividend stock. But
developing a dividend investment strategy often can result
in disaster when their is a dividend cut.
As well sometimes
economic events change and the dividend stock ends up going through a
dividend cut. When this happens, many investors sell their
dividend stock often incurring large losses and regretting
their dividend investment strategy. I believe this is a
mistake. I believe many investors need to rethink their
dividend investment strategy. That is the goal of this 4
part article.
In the bear
market collapse in late 2008 to early 2009, many dividend paying stocks
cut their stock dividends as earnings collapsed with the world's
economies facing the greatest economic threat since the
Great Depression.
Indeed analysts and economist
worldwide believed that the world's economies would face
severe hardships. It was due to this belief that countries
around the world increased money flows and sovereign debt in
the belief that this might save the world from a global
economic disaster. Whether it worked will not be known for
years to come.
In the face of
the crisis many dividend paying stocks went through a
dividend cut. But often when a dividend paying stock cuts
its dividend, the stock has already collapsed.
For example here is the chart of Wells Fargo Stock (WFC). By
the time the dividend cut was announced on March 6 2009 the
Wells Fargo stock was already near the bottom of its plunge.
On March 6 2009 when the dividend cut was announced, Wells
Fargo stock would have made an excellent buy.
Below is the chart of General Electric Stock. By the time
the dividend cut was announced on Feb 27 2009, the stock has
already plunge and didn't have much further to fall.
Below is the chart of Bank Of America Stock.
At the time of the first
dividend cut Bank of America stock was still above $30.00. With the
second dividend cut Bank Of America stock was down to just above $7.00.
Buying Bank Of America stock after the first dividend cut
was announced would have been a disaster.
When dividend paying stocks have a dividend
cut many investors wonder if the depressed stocks are
actually good buys once they
have made the dividend cut announcement. In the case of many
stocks like AIG and Bank of
America, the answer is a resounding no, at least for the
past couple of years. In fact the likelihood of stocks like
AIG recovering are remote. One thing is certain, when a dividend stock goes
through a dividend cut, a investor's dividend
portfolio is already damaged. It is probably too
late for a dividend investor to sell without significant
losses.
But for every investor selling someone is busy buying.
However many stocks that have gone through a
dividend cut are actually strong companies, trying to
survive a rough economic cycle. In some cases the dividend
cut is actually the correct thing to do. For my study I
picked what I believe is one such company, General Electric.
No commissions are taken into
account for any of the trades shown here.
GENERAL ELECTRIC IN DISARRAY
When General Electric announced on Feb 27 2009 that for the
first time since the Great Depression they were going to
do a dividend cut, the
stock had already collapsed as had earnings. In
December 2007 GE earnings were 68 cents per share. Just a
quarter later in March 2008 they had fallen to 44 cents a
share. By September 2009 they had fallen to 22 cents a
share. General Electric stock had no choice but to go
through a dividend cut.
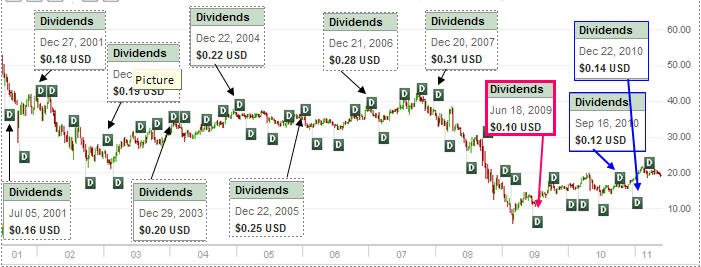
Below is a 10 year chart on GE. I have plotted out the
various dividends being paid by GE over the last 10 years.
Even at the time of this writing (May 27 2011) the dividend
is not at the level it was in 2001.
Within days of the announced dividend cut General Electric
stock reached its low of the bear market, falling to
$5.73 on March 4 2009.
ARE DIVIDEND STOCKS THAT HAVE A DIVIDEND CUT,
GOOD BUYS?
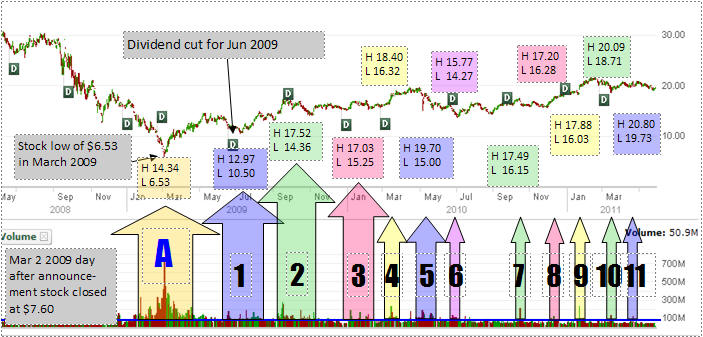
On the chart below I have plotted out a number of key
points for General Electric Stock. First is the market panic in Feb 2009 to Mar 2009 which saw
the stock trade at an unprecedented low of $5.73
A) The yellow ARROW which I have marked "A" plots the
height of the stock market panic period.
B) The first dividend payout from the cut to 10 cents in June 2009 is also
plotted.
C) The remaining arrows numbered 1 through 11 are plotting volume
on those days when the stock
volume was higher than normal.
D) The blue line running across
the stock volume is the average volume for given days.
Anything above the blue line is above average volume.
These are the days I am following. I have plotted on the
chart the high and low prices for each of the higher volume
days.
What I will try to look at is whether or not a stock such as
GE stock would be a good buy after the dividend cut was announced.
The problem with so many studies of stocks that cut their
dividends, is that they are based on an investor buying the
stock at the low and selling it at a high point. In
hindsight this would be an easy trade. But this is hardly
realistic.
Most investors when a stock is collapsing, will
run from it. For example when GE stock fell all the way to $5.73
many traders who bought at $10.00 and $9.00 would unload
in horror. If an investor bought GE at 9.00 and it fell to
$6.00 that is a 30% loss. The average investor would not
take a 30% loss, but would be out in a flash. So while it is
easy to plot stock decisions based on hindsight, it is
obvious just by volume alone that when the February and March
2009 lows came, there were lots of sellers just as there
were buyers, but as the stock kept falling, even buyers at
what they had thought were lows, became sellers. A stock
like GE does not fall to $5.73 without a stock market panic.
The value of doing a strategy such as this is to have
this knowledge available to draw upon for such an event in
the future. The bear market of 2007 to 2009 was not unusual.
The fact that it was primarily focused on financials was
unusual, but in bear markets, stocks fall much further than
investors realize or even believe. That is why doing a
strategy study such as this one, is of significant value as
it prepares an investor for the next market collapse and the
opportunities that it presents.
In order to be as objective as possible, I will approach
this study from a number of angles.
Once the dividend cut was announced General Electric stock fell even
further and market panic was already running rampant. The chance of
a long term investor buying at such stock market panic levels is slim. At
the time of writing this article May 27 2011, GE is trading
at $19.47 and I will use that price for a sell point.
STUDY 1: THE INVESTOR WHO ACCUMULATES
If an investor wanted to accumulate shares in lots of 100
shares over the course of the above chart, there is no way
that the investor would have bought shares at the low every
time, and probably not the high each time. Therefore for this
study I will take the average of each high volume day after
the stock commenced recovery.
As explained above, I
have numbered each high volume day. They run from 1 to 11.
Most investors take the approach that the time to buy a
stock is at a low point but they prefer not to buy during a
market panic or market sell off. During a
stock market panic, if the investor has cash available, normally they will sit at
the sidelines until the stock market bottoms appears to have been
reached. With GE Stock that appeared to be the case by June 2009
about 3 months after the market panic of Feb - Mar 2009 had ended and
the market seemed to have made a bottom. The first period
then is marked 1. Starting at 1 and going through to 11,
here are the averages for those high volume days. Based on
this study, our fictitious investor buys 100 shares at each
average.
1. 11.74 - 100 shares = 1174.00
2. 15.94 - 100 shares = 1594.00
3. 16.14 - 100 shares = 1614.00
4. 17.36 - 100 shares = 1736.00
5. 17.35 - 100 shares = 1735.00
6. 15.02 - 100 shares = 1502.00
7. 16.82 - 100 shares = 1682.00
8. 16.74 - 100 shares = 1674.00
9. 16.96 - 100 shares = 1696.00
10. 19.44 - 100 shares = 1944.00
11. 20.26 - 100 shares = 2026.00
TOTAL CAPITAL INVESTED - $18377.00 / 1100 shares = $16.70 average
cost - sold today at $19.47 = $3040.00 gain = 16.5% gain.
Dividends earned = $420.00
TOTAL RETURN WITH DIVIDEND INCOME = 18.8%
This is a return from June 2009 or about 23 months of about
0.82% per month.
SUMMARY OF STUDY 1: Therefore based on the above scenario an
investor who bought after the dividend cut, profited by
16.5%. The question here would be, would an investor risk
their capital on General Electric Stock after such a
collapse for a return of 0.82% per month? Personally I would
consider this a reasonable trade, but as I prefer selling
puts, I would not have taken this trade.
STUDY 2: THE INVESTOR WHO ACCUMULATES STARTING ON
THE DAY AFTER THE ANNOUNCED DIVIDEND CUT
Taking the same figures from the first study marked number
1, let's add in 100 shares at the close of March 2 2009, the
first trading day after the announced dividend cut. That
changes the outcome quite dramatically.
A. BOUGHT 100 SHARES AT CLOSE MAR 2 2009 - $7.60 =
$760.00
1. 11.74 - 100 shares = 1174.00
2. 15.94 - 100 shares = 1594.00
3. 16.14 - 100 shares = 1614.00
4. 17.36 - 100 shares = 1736.00
5. 17.35 - 100 shares = 1735.00
6. 15.02 - 100 shares = 1502.00
7. 16.82 - 100 shares = 1682.00
8. 16.74 - 100 shares = 1674.00
9. 16.96 - 100 shares = 1696.00
10. 19.44 - 100 shares = 1944.00
11. 20.26 - 100 shares = 2026.00
TOTAL INVESTED - $19137.00 / 1200 shares = $15.95 average
cost - sold today at $19.47 = $4227.00 gain = 22.08% gain.
Dividends earned = $510.00
TOTAL RETURN WITH DIVIDEND INCOME = 24.75%
This is a return from June 2009 or about 23 months of about
1.07% per month.
SUMMARY STUDY 2: This is a much better return. However the
question arises, how many dividend stock portfolio investors
would risk their capital on GE the day after the dividend
cut was announced?
STUDY 3: THE INVESTOR WHO BUYS JUST AT THE CLOSE OF
THE DAY AFTER THE ANNOUNCEMENT
The investor buys 100 shares at the close on MAR 2 2009 at $7.60 =
$760.00
TOTAL INVESTED - $760.00 / 100 shares = $7.60 average
cost - sold today at $19.47 = $1187 gain = 156.18% gain.
Dividends earned = $90.00
TOTAL RETURN WITH DIVIDEND INCOME = 168.02%
This is a return from June 2009 or about 23 months of about
7.30% per month.
SUMMARY STUDY 3: This is of course the best return. However
this would appear to be more a trader's style and not the
realm of a dividend investor who buys for the dividend and
holds long term.
.
SUMMARY
There are many different strategies that could be applied to
this trade. But when analysts comment about buying dividend
stock after a dividend cut, it depend on the
company itself. AIG, Bank Of America and many others have
not recovered from their dividend cuts of 2008 and 2009.
Even General Electric stock has not recovered. Therefore it
would depend on the investor and his willingness to
risk his capital on a stock that has already announced it is
in trouble by cutting the dividend.