2011 Fundamentals
Market Capitalization $143.9B
Revenue (FYR) $35.1B
EPS $5.05
P/E Ratio 12.4x
Shares Outstanding 2.3 B
Book Value $13.53
Dividend: $1.88
Coca-Cola Co is a profitable Beverages (Nonalcoholic)
company that trades on the NYSE. It is a manufacturer,
distributor and marketer of nonalcoholic beverage
concentrates and syrups in the world. Finished beverage
products bearing its trademarks are sold in more than 200
countries.
The Company markets nonalcoholic sparkling
brands, which include Diet Coke, Fanta and Sprite. The
Company manufactures beverage concentrates and syrups, which
it sells to bottling and canning operations, fountain
wholesalers and some fountain retailers, as well as finished
beverages, which it sells primarily to distributors.
The
Company owns or licenses approximately 500 brands, including
diet and light beverages, waters, enhanced waters, juices
and juice drinks, teas, coffees, and energy and sports
drinks. During 2008, the Company acquired the brands and
licenses in Denmark and Finland from Carlsberg Group
Beverages (Carlsberg).
In my opinion, Coke remains among the strongest of US Companies for
stock holders interested in covered call and naked put
writing. This looks like a good stock for my strategy.
Terms
Of Use
By using this site,
you agree to be bound by its terms of use.
The full terms of
use can be read here.
If you do not agree to the terms of use, do not access or use
this site.
Nothing presented is financial advice, trading advice or
recommendations. Everything presented is the author's ideas
only. The author accepts no liability for its use including
errors and omissions. You alone are solely responsible for your
own investing and trading. There are considerable risks involved
in implementing any investment strategies and losses can be
large. Trade at your own risk.
COCA COLA STOCK -
2011
COCA COLA STOCK SYMBOL
- KO
ONGOING EVALUATION
& TRADE
- Year 3
This will
remain an ongoing trade. The chart on Coca Cola shows a
strong company with excellent put selling potential. I
will be selling Naked Puts until I either accept
assignment OR get assigned shares. Then I will turn to
covered calls on Coca Cola Stock. Should Coca Cola stock fall too low making
covered call selling impractical I will add to my stock
position through selling puts to lower my overall
cost and average into the stock at lower prices. This is a long term trade. Over the past two years I
have been using a reverse ladder approach when selling Coca
Cola Stock Options. This is selling
puts at lower strikes the further out I go in time.
This protects in the event the stock has a major pullback
and I end up being assigned on the way down. It would put me
into the stock at an average lower price. This being the
third year of my Coca Cola Stock option trade, I can afford to become more aggressive with my
strike choices and stay closer to at the money rather than
far out of the money puts.
Looking at the fundamentals, if you flip back to the 2009
Coca Cola trades, you can see the increase in earnings,
market cap, earning per share and Coca Cola dividend. The
P/E is up slightly but overall this is the kind of
fundamentals I like to see, annual increases in worth,
dividend and a low PE.
Should you find my strategy and ongoing evaluation of
this trade of value I hope you will consider a tip
for the time I spend detailing out this trade.
I have set up a Paypal account for those
who would like to donate. Thank you in advance. Remember, nothing on my site is financial advice.
They are just my ideas and opinions. Investing is risky and losses can be large. Trade
at your own risk.
Read the
terms of use
YEAR 1: 2009 - Trade Commenced May 1 2009 Goal for 2009:
8% (8 months)
Strategy: Sell Naked Puts Until Assigned
Capital In Use At End Of 2009
102,000.00
Income Earned in 2009 (8 months)
12,895.00
Return On Capital in 2009 (8 months)
12.6%
YEAR 2: 2010 Goal for 2010: 12%
Strategy: Sell Naked Puts Until Assigned
Capital In Use At End
Of 2010
42,250.00
Income Earned in 2010
6,477.75
Return On Capital For
2010
15.3%
YEAR 3: 2011 Goal for 2011: 12%
Strategy: Sell Naked Puts Until Assigned
Capital Currently In Use
38522.75
Income Earned in 2011
7469.25
2011 - Annualized Return On Capital
24.61%
TOTAL INCOME EARNED
TO DATE
26842.00
Total Of My Own Capital
Required
11680.75
Number Of Shares if
assigned
700
Share Price Valuation
(Total Capital Required/Number of shares)
16.69
TRADE COMMENCED May 1 2009
GOAL FOR 2011:
12%
ONGOING STRATEGY
- SELLING NAKED PUTS UNTIL ASSIGNED * ACTIVE TRADES ARE HIGHLIGHTED
IN YELLOW
Oct 15 10
59.90
STO 5 NP JAN 57.50 @ 1.35
13.25
28763.25
661.75
2.30
18491.50
Nov 5 2010: THERE'S NOTHING LIKE COKE
Sometimes making money comes easy and Coke has
been an excellent performer. Today I closed my Jan
55 naked puts which I sold back in Dec 2009 and Feb
2010. - I made $2375.50 at the time of closing, and
held 27,500.00 in capital to secure the position.
The Return is a very nice 8.6% for an average
holding period of about 10.5 months, with not work
on my part. Many people feel that selling naked puts
for income means selling just one or two months out.
But for some companies the long range chart offers a
lot of potential for long range naked put selling.
UPDATE NOV 10 2010: To continue this trade I
have sold 2 Naked Puts for Jan 55 for 2.81. I will
eventually sell more but I want to wait to see if
coke pulls back and honestly, I have a long time
until Jan 2012 so there is plenty of time to see if
KO should pullback and I can sell some more Jan
Naked Puts
for better premiums.
Nov 5 10
62.29
BTC 5 NP JAN 55 @ .23
13.25
(128.25)
(0.41)
18363.25
Nov 10 10
62.55
STO 2 NP JAN (12) 55.00 @ 2.81
9.50
11009.50
552.50
5.01
18915.75
Dec 7 10
64.20
BTC 5 NP JAN 57.50 @ .14
13.25
(83.25)
(0.24)
18832.50
Dec 7 10
64.20
STO 5 NP Jan 62.50 @ .68
13.25
31,263.25
326.75
1.04
19159.25
Dec 31 10
65.50
STO 5 NP Feb 62.50 @ .61
13.25
31,263.25
291.75
0.93
19451.00
Dec 31 10
65.50
BTC 5 NP Jan 62.50 @ .13
COMMENTS: This is an easy trade to decide on. The stock
continues to hold to the upper bollinger and this is a
simple roll from Jan to Feb at the same strike for more
premium.
13.25
(78.25)
(0.20)
19372.75
Carry Forward from 2010 $19,372.75
Feb 18 11
64.55
Expiry 5 Naked Puts Feb $62.50 expired
Mar 16 2011: Last October Coke
was around $60.00 and I was selling the $57.50 put.
With today's pullback I was able to sell April $60
put strike for a 1.5% premium. The chart on Coke
looks poor, but it's more because of the market
condition than Coke itself. I sold just 3 naked puts
and will sell another 3 should the opportunity
present itself for better premiums, if the stock
falls lower. So how low could KO fall? The pullback
for Coke has been very dramatic all week. The stock
has fallen right through the 50 day, and now the 100
day EMA. The stock has broken support which sat
around $62.50. The next major support is at $60.00
I sold just 3
naked puts for April. If the stock falls through
$60.00 there is not much support until around $55.00
to $57.50. The chart below is for the past year.
$60.00 marks the 200 day EMA at the present time. I
would love to sell the $55.00 naked put again on
this stock and I may yet get the opportunity. At
present I am hold Jan 2012 55.00 naked puts and now
the April $60.00. You can see that a pullback
to $57.50 or even $55.00 will take the stock back to
September 2010 and could mark a lower trading range
for Coke. With a dividend of $1.88 - that would mark
a yield of 3.4% at $55.00. I would think there
should be good support at those levels. If KO breaks
through $60.00 then it may be an easy drop to
$57.50. I am holding the remaining puts back to see
where the stock heads from here.
Mar 16 11
61.55
STO 3 Naked Puts April 60 @ .90 expired
10.75
18010.75
259.25
1.43
19632.00
Mar 17 11
62.20
Bought 300 shares @ $62.20
Comments: Today I am committing my capital earned
and purchasing 300 shares. I believe the trend is
back up for Coca Cola and I will hold my shares for
a week or so and see at what price I can sell at.
300
7.00
(18667.00)
(18667.00)
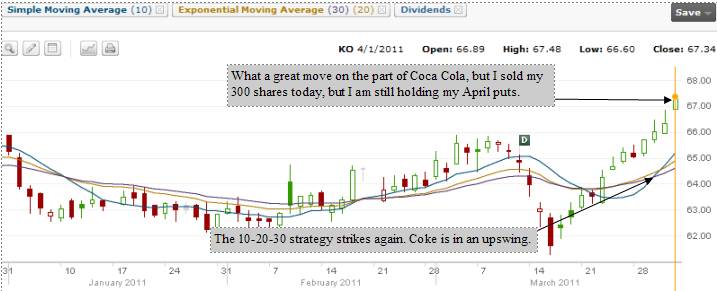
Apr 1 2011: No April Fool's
Joke today, I sold my Coca Cola Shares. I am
continuing to hold my April 60 naked puts. At $60.00
Coke is fairly valued and I would be content to own
it.
Apr 1 11
67.34
Sold 300 shares @ $67.34
0
7.00
20195.00
0.00
1528.00
8.1
21,160.00
Apr 15 2011:
I am still holding 3 naked puts for Jan 2012 at
55.00. I don't like any of the at the money puts on
KO. I would prefer the 62.50 put. Looking at the
stock it has had a fast run up. MACD is indicating
that the stock may have topped here for a bit. I
will wait for a pullback in KO or see what premiums
are like for June $62.50 on Monday.
Earnings were .86 cents per share for the quarter
and the consensus was for .87 and the stock sold off
to 65.81. It wasn't really the 1 cent miss, it was
the fact that the CEO Muhtar Kent, said "I am
pleased with our first quarter results.
Despite ongoing global
geopolitical challenges," That's all it
takes some times. Remember the market is run by
fear. Fear of missing a rally and fear of being
caught in a downturn. It's like US President
Roosevelt said during the depression, "The only
thing we have to fear is, fear itself" and for stock
and commodities markets, that pretty well sums it up
every day.
I jumped in and sold
some JUNE $62.50 puts as I remain risk averse to
selling at the $65.00 strike. I would love to sell
the 65 strike but each time the stock gets up there,
it has trouble. The return for the JUNE $62.50 naked
put is slightly less than half a percent a month,
but if there is some more selling in KO, it could
easily fall back to around $62.70 as it was just a
month ago. I will take advantage of any further
weakness and keep selling naked put contracts to
build up a position, whenever the opportunity
arises.
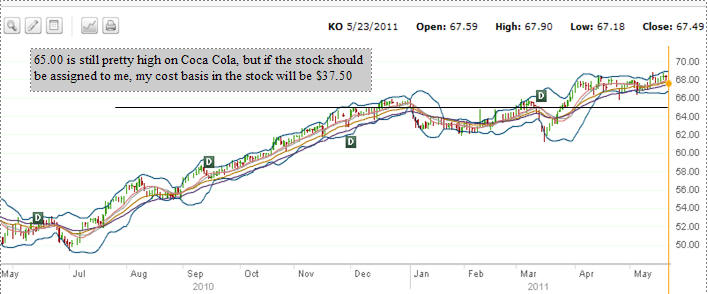
MAY 23 2011:
.
Today's selling presented an opportunity. I bought
to closed by June $62.50 puts so I could use the
capital to apply to selling 8 naked puts for JULY
$65 at 0.85. I realize looking at the chart that
$65.00 is in the high range, but with Coca Cola I do
not believe it is yet over valued and with it
trading at 13X earnings and earnings being so good,
I believe this is a great strike. Should I be
assigned, my actual cost basis is $37.51 due to the
large amount of income I have made over the past 2
years.
May 23 11
67.24
STO 8 Naked Puts JUL $65 @ .85
17.00
52017.00
663.00
1.27%
22,006.50
Jun 1 11
67.00
BTC 8 Naked Puts Jul $65 @ .92
17.00
(753.00)
(1.44)
21,253.50
JUNE 8 2011
I bought to close my 8 naked puts
for July on June 1, as it seemed obvious to me that
Coca Cola would pull back. Today I went back in and
sold a small reverse ladder of puts, selling the Aug
$60.00; $62.50 and $65.00. The majority of the puts
are at the $62.50 strike. I am still holding January
$55.00 puts. I believe looking at the past 3 years
in Coca Cola that the stock has a good chance of
ending up somewhere between $55.00 and $60.00 during
the second half of the year. There could easily be a
rally in the fall. My plan is pretty straight
forward. If the stock pulls back to $60.00 by
August, I will be rolling out my reverse ladder into
the fall and I will reduce the number of contracts
in the roll. If the stock falls 10% to reach $60.00,
then put premiums will be larger going into the
fall, allowing me a very good profit to do my
rolling forward of these puts. Meanwhile with the
amount of capital earned since starting the trade
two years ago, combined with the capital now being
used, would afford me 1200 shares at a cost basis of
$42.51 if I was assigned on all shares. Meanwhile I
look forward to more volatility to increase premiums
in my August puts.
Jun 8 11
65.10
STO 5 Naked Puts Aug $62.50 @ 1.02
13.25
31,263.25
496.75
1.58%
21750.25
Jun 8 11
65.10
STO 3 Naked Puts Aug $60 @ .54
10.75
18,010.75
151.25
0.83%
21,901.50
Jun 8 11
65.10
STO 2 Naked Puts Aug $65 @ 1.95
9.50
13,009.50
380.50
2.92%
22,282.00
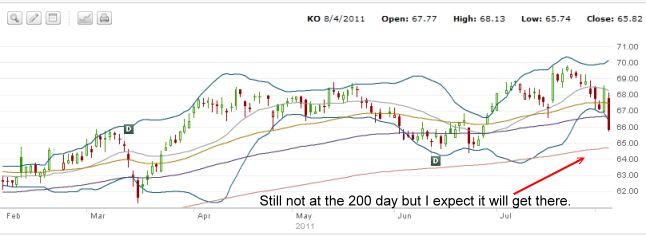
AUG
4 2011
I bought to close all my August
puts and luckily since I had sold these puts so far
out of the money all the puts left me with a profit.
I have closed now not so much in case the stock
falls but to free up cash in the event that the
stock falls further and I want to sell puts or naked
calls at a lower level. Right now though I kind of
doubt the stock will fall much further for a few
days. I am still holding my January $55.00 puts
since that would be an excellent price point to
enter Coca Cola should it fall that low.
Today Coca Cola Stock
fell through the 100 day. The 200 day is down just
below $65.00. I don't think the stock will get there
overnight but in a bear market I think it is bound
to happen. Back in mid-March the stock fell below
$62.00. That will be my price point to wait for.
Aug 4 11
66.15
Bought to close 3 Naked Puts Aug $60 @ .15
10.75
(55.75)
(0.31)
22226.25
Aug 4 11
67.70
Bought to Close 5 Naked Puts Aug $62.50 @ .28
13.25
(153.25)
(0.49)
22073.00
Aug 4 11
67.67
Bought to close 2 naked puts Aug $65 @ .67
9.50
(143.50)
(1.1)
21929.50
AUG
9 2011
After yesterday's market collapse
I thought today might prove eventful for some of my
favorite stocks and Coca Cola turned out to be one
of them. I sold the Sept $60.00 for $1.10