Market Cap 30B
Revenue (FYR) $15B
EPS (TTM) $5.85
Shares Out. 521.8M
Book Value $13.64
P/E 10.9x
Price/Sales (FYR) 1.8x
P/Cash Flow (TTM) 8.7x
Research In Motion Ltd is a
profitable Communications Equipment company that trades on
the TSX and the NASDAQ. Research In Motion Limited (RIM) is
a designer, manufacturer and marketer of wireless solutions
for the worldwide mobile communications market. Through the
development of integrated hardware, software and services
that support multiple wireless network standards, RIM
provides platforms and solutions for access to information,
including e-mail, phone, short message service (SMS),
Internet and intranet-based applications. RIM's portfolio of
products, services and embedded technologies are used by
organizations worldwide and include the BlackBerry wireless
solution, the RIM Wireless Handheld product line, software
development tools and software. RIM operates offices in
North America, Europe and Asia Pacific.
Terms
Of Use
By using this site,
you agree to be bound by its terms of use.
The full terms of
use can be read here.
If you do not agree to the terms of use, do not access or use
this site.
Nothing presented is financial advice, trading advice or
recommendations. Everything presented is the author's ideas
only. The author accepts no liability for its use including
errors and omissions. You alone are solely responsible for your
own investing and trading. There are considerable risks involved
in implementing any investment strategies and losses can be
large. Trade at your own risk.
RESEARCH IN
MOTION (RIM) - 2010
ONGOING EVALUATION
& TRADE
- Year 2
This trade is taking place on the TSX.(RIMM - NASDAQ) The
same trade could be done on the NASDAQ. This is a trade using the
10-20-30 strategy of moving averages
(read the 10-20-30 trading strategy
paper here) for timing of my option trades. Nothing on my site
is financial advice or recommendations. GOAL: Average 15% a year in income
OBJECTIVE: I am using the 10-20-30 strategy of moving
averages to assist in
deciding when to sell puts and calls and buy to close them.
If at any time I am holding shares, it will be for short
periods only. The focus is on selling option positions for
income to meet the goal.
SUMMATION:
My chart with each transaction, shows how I am interpreting
this rule and applying it to assist my decision making
process to time my trades. I am following this strategy to
see if I can use the 10-20-30 moving averages strategy
consistently for profits. There is no fool proof way to invest
in stocks. I am aware that I cannot just blindly
follow a technical indicator but must look at numerous factors.
By writing up
each of my trades I can build a history to re-examine each
trade to determine what
factors I am considering that are working and which factors
are not. I will keep my quantities to within 5 contracts for
each position taken. I am also doing a smaller number of
contracts to see if even with a small capital I could use
this strategy.
I am also
aware that the strike position taken has a
large impact on not just income, but also on risk. I am
always focused on risk and plan to stay out of the money
with my strikes as much as possible.
**Notes on the percent return - I am not breaking this trade
down by month or day or year. Instead I am taking each
position and calculating the simple percent return on the
trade position over the period of the trade. Percent returns
in brackets indicate percent given back when the position is
bought to close (BTC).
BTC = Buy To Close
STO = Sell To Open
Should you find my strategy and ongoing evaluation of
this trade of value I hope you will consider a tip
for the time I spend detailing out this trade.
I have set up a Paypal account for those
who would like to donate. Thank you in advance. Remember, nothing on my site is financial advice.
They are just my ideas and opinions. Investing is risky and losses can be large. Trade
at your own risk.
Read the
terms of use
YEAR 1: 2009 - Trade Commenced Jun 2 2009 Goal for 2009:
7% (7 months)
Strategy: Sell Naked Puts Until Assigned
Capital In Use At End Of 2009
104,007.00
Income Earned in 2009 (7 months)
9,070.50
Return On Capital in 2009 (7 months)
8.7%
YEAR 2: 2010 Goal for 2010: 15%
Strategy: Sell Naked Puts Until Assigned
Capital In Use At End
Of 2010
32,000.00
Income Earned in 2010
12,533.25
Return On Capital For
2010
39.16%
TRADE COMMENCED June 2 2009
GOAL FOR 2010:
15%
ONGOING STRATEGY
- 10-20-30 Moving Averages Strategy
Capital
Committed
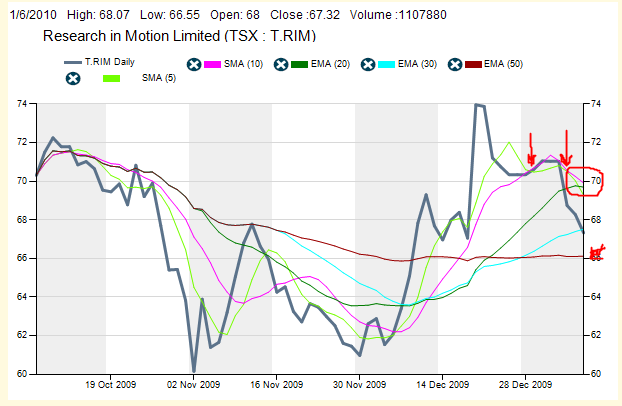
JAN 6 2010: With the new year the downtrend has
continued with RM. The 5 and 10 day have crossed the 20 day
and are working their way to the 30 day. You can see in the
chart that the 5 day rapidly movd up with the earnings news and
then the 10 day never caught up. The 5 day pulled
back and now is falling with the 10 day. The only
deviance is that the 10 day is stalled at 70 while
the 5 day continues to move lower. Meanwhile
resistance remains at 74.00 and support at 60.
Jan 6 2010
67.78
STO 5 Calls Feb 74 @ 1.05
1.4
500
68.01
13.25
(34007.00)
511.75
9582.25
179,007.00
JAN 11 10
66.63
BTC 5 COVERED CALLS JAN 68 @ .61
Comments: Capital committed does not change as these are
covered calls
(0.89)
500
68.01
13.25
(34007.00)
(318.25)
9264.00
179,007.00
JAN 11 10
66.63
STO 5 COVERED CALLS FEB 68 @ 2.40
Comments: Capital committed does not change as these are
covered calls
3.5
500
68.01
13.25
(34007.00)
1186.75
10450.75
179,007.00
Jan 15 10
67.96
Expirations: 5 Naked Calls Jan 76
Expired
500
68.01
(34007.00)
141,007.00
Jan 19 10
64.70
BTC 5 Calls Feb 80 @ .15
500
68.01
13.25
(34007.00)
(88.25)
10362.50
101,007.00
Jan 26 10
65.60
BTC 5 Puts Feb 60 @ .59
(.90)
500
68.01
13.25
(34007.00)
(308.25)
10054.25
71,007.00
Jan 26 10
65.60
BTC 5 Covered Calls Feb 68 @ 1.23
Comments: Capital committed does not change as these are
covered calls
(1.8)
500
68.01
13.25
(34007.00)
(628.25)
9426.00
71,007.00
Jan 26 10
65.60
STO 5 Covered Calls Mar 68 @ 2.55
Comments: Capital committed does not change as these are
covered calls
3.7
500
68.01
13.25
(34007.00)
1261.75
10687.75
71,007.00
JAN 29 2010: Here we are at the end of January and
the stock basically was stick in a range most of the month.
While this may seem good for us it actually reduces the
premiums in the options as the volatility declined. I closed
the Feb 74 Naked Calls today at .32. It is important to
remember that this is a trade, not a holding. With more than
3 weeks left of trading and just .32 cents to make I would
rather close out now, locking in the profit and wait for the
next trend on the stock. Right now it looks like a possible
downtrend. We need volatility to return to this stock to get
option premiums up.
Jan 29 10
67.47
BTC 5 Calls Feb 74 @ .32
(.40)
500
68.01
13.25
(34007.00)
(173.25)
10514.50
34,007.00
MARCH 3
2010: It's been over a month since I
last viewed RIM. I am still holding my 68.00 March calls and
closing the Feb 74 calls was a good choice, otherwise I
would have had to purchase more stock as the share value has
moved higher. I have added the 50 day to the chart to show
that the stock has recovered from its disappointing
earnings. On the last move lower in Jan the stock fell to
just below 65. I will therefore sell 5 naked puts at $64 for
April. $64 was the same strike I was selling back in October
2009. At this stage I would normally sell the April 80 naked
calls. That would bring in 1.45 in premium. However I am
holding the Mar 68 since December and it's actually a pretty
good spot to be in. $68.00 is a nice value on this company.
If I buy back the Mar 68 and sell the April 68 I will
increase my premium by about 1.35. Therefore why take on
additional risk at 80, when I can make the same amount by
rolling my Mar 68 covered calls to April. Therefore I am
rolling to April 68 for additional premium.
Mar 3 10
73.18
STO 5 Naked Puts Apr 64 @ 1.00
1.5
500
68.01
13.25
(34007.00)
486.75
11001.25
66,007.00
Mar 3 10
73.18
BTC 5 Covered Calls Mar 68 @ 5.40
Comments: Capital committed does not change as these are
covered calls
(7.9)
500
68.01
13.25
(34007.00)
(2713.25)
8288.00
66,007.00
Mar 3 10
73.18
STO 5 Covered Calls Apr 68 @ 7.10
Comments: Capital committed does not change as these are
covered calls
10.4
500
68.01
13.25
(34007.00)
3536.75
11824.75
66,007.00
MARCH 12 2010: Yesterday the
stock rose to 78.78 and fell to 77.07 before closing at
77.72. Volume has slowly been decreasing. This has presented
us with a bearish candle for today and again, we have bumped
right up against the resistance at $78.00. This could be a
great opportunity to sell 5 calls for April 85 @ 1.25.
Should the stock get to this level I will buy 500 shares and
turn it into a covered call. Meanwhile I believe looking at
the chart there is good support around the 70 level. I will
watch for further weakness and possibly consider selling the
April 70 puts.
Mar 12 10
77.93
STO 5 Naked Calls April 85 @ 1.25
1.4
500
68.01
13.25
(34007.00)
611.75
12436.50
108,507.00
Mar 29 10
77.26
BTC 5 NP Apr 64 @ .20
(0.31)
500
68.01
13.25
(34007.00)
(113.25)
12323.25
76,507.00
Mar 29 10
77.26
STO 5 NP Apr 70 @ .90
1.2
500
68.01
13.25
(34007.00)
436.75
12760.00
111,507.00
Mar 30 10
75.24
STO 3 NP APR 70 @ 1.30
1.8
500
68.01
10.75
(34007.00)
379.25
13139.25
132,507.00
APR 6 2010:
The sell
off was swift and the volume large when the earnings
new came out just a few trading days ago. The stock
fell almost 10% in two trading days and the
Oscillator showed OVERSOLD. This told me that a
bounce would soon be coming and this morning I
looked at a couple of strategies. I could buy to
close my covered calls for Apr 68 and roll to May
68, which I originally thought was fairly decent.
However the premiums were not enough and I felt it
was time to get out of the stock and back to naked
positions.
I therefore sold 5 naked puts
for May 68 at the open. Then I bought the Apr 68
covered calls back first thing in the morning and
put in an offer to sell my 500 shares for $69.95,
just .05 cents short of 70.00. I thought there was a
chance on the volume I saw in the morning that the
stock would move up and possibly reach 70.00. I was
taken out at 69.95 which mean't my cost to buy back
the April 68 calls was covered, plus an additional
profit of .25 cents per share was made. Overall the
trade netted me 2.95 per share before commissions
and has me back at the 68 strike point. I hope to
roll these puts a few times but overall I think RIM
is undervalued. The darling right now is APPLE which
is trading at 29 times earnings while RIM is at 16
times earnings. I think RIM has lots of room to move
around and should provide some good option premiums
moving forward.
Apr 6 10
68.00
BTC 5 Covered Calls Apr 68 @ 1.75
Comments: Capital committed does not change as these are
covered calls being bought and closed out - This is the end
of the Covered Call Rolls. The stock was sold today as well.
(2.4)
500
68.01
13.25
(34007.00)
(888.25)
12251.00
132,507.00
Apr 6 10
68.00
STO 5 NP May 68 @ 2.70
4.0
500
68.01
13.25
(34007.00)
1336.75
13587.75
166,507.00
Apr 6 10
69.95
Sold 500 shares at 69.95
COMMENTS: Capital committed changes by $68 X 500 plus the
original $7.00 of commission for a total deduction from
capital committed of $34,007.00
2.8
0
0.00
7.00
34968.00
0.00
961.00
14548.75
132,500.00
APR 16 2010:
STUCK IN
A RANGE. So it appears Rim is stuck in a range. It's
a $10.00 dollar spread. Looking at the 10-20-30
averages, the risk definitely seems to be on the
downside. As of April option expiry I am only
holding 5 puts for May 68. What should I do next?
With the bias to the downside as indicated by the
moving averages I will place my trades to the call
side and sell the $78.00 strike to start. I will
then sell more option positions as the stock
dictates. May option expiry is May 22, about 5 weeks
which might afford the options a bit more time to
expiry and possibly better premiums.
Review: Since commencing the trade in June 2009, I
have had held shares in RIM just once, which was at
the 68 strike. I am no longer holding shares and as
of Friday I am holding 5 Naked Puts for May at the
$68 strike.
As of Friday (Apr 16 2010), I
have updated my chart and my strategy concerning
RIM. I believe while many analysts think RIM could
double in the next 12 months, they are probably
wrong. The market that RIM practically created
through its blackberry devices has become far more
competitive and there are a lot of new entries.
During the past week I was able to enjoy viewing the
NEXUS ONE phone from Google with EVE and
of course the IPhone. I have many friends who have
dropped their blackberries and moved to the IPhone.
I myself would probably consider the NEXUS ONE
phone. I love their GPS using Google maps and Google
earth. Walking along a street, I could take the
nexus one and literally view the buildings as I
walked past. The phone told me where I was and
showed me where I needed to go and what the building
would look like that I was trying to reach. Overall
I was impressed.
While almost all the phones can
accomplish similar tasks, what this tells me though
is that the market itself is becoming more
fragmented. RIM, once the dominant player in a
market that it created, now has to contend with
selling cheaper phones and lowering or enhancing
monthly subscription rates, all the while competing
with more and more companies and plans. A recent
article indicated that by 2010 a full 25% of the
world's population will be interconnected through
mobile phones and other mobile devices. Rim is
trading at 14.6 times earnings. Google trades at
about 25 times earnings, but Google is not RIM. It
has varied streams of income being generated whereas
RIM’s market is far more focused.
For RIM to increase in value,
earnings must increase or at least the expectation
of earnings potential has to increase for the stock
to increase its multiple and move considerably
higher. There remains always the ability of RIM to
buy out smaller companies such as the rumor about
PALM, or even the rumor that RIM may be bought out.
Meanwhile RIM can move into other countries, such as
they are endeavoring with China. But when entering a
new marketplace they will be pitted against other
companies. Mobile products in general, I believe,
will begin to feel the "technology effect" where
just as in other technology areas, prices continue
to decline for both the product itself (the
handheld) and for the plans being offered.
Competition is a wonderful thing for consumers but
it can and in the hand held market, probably will
impact earnings growth.
I am sure that RIM will continue to grow, but the
question remains whether or not the overall profit
margins can mushroom as they have in the past, to
delight investors and push share valuations even
higher. If RIM should decide to expand and issue
more shares, as so many companies has in the past,
RIM will dilute shareholder value (something Warren
Buffet hates) and almost always reduce shareholder
value and hence share price.
Nonetheless, since commencing
in June 2009, I have generated 14935.00 through
following the 10-20-30 charts of moving averages and
selling naked calls and puts against those averages.
During this time period the largest amount of
capital at risk of being required was $132,000. On
average the capital which might actually be required
was around $80,000. The original goal was to gain
15% annual return on capital invested. The return to
date based on 14,935 / 80M = 18.6% with 2 months
left in the first year. If it was possible to
continue with the type of return, I could realize a
100% return in about 4 more years.
Factors though that could
affect this return may be the stock itself. If the
stock continues to trade in smaller ranges with a
bias toward neutral to bearish, the volatility will
decrease and option premiums will be reduced. Once
premiums do not afford more than 1.5% return per
month, it would be time to move to another stock,
unless I want to reduce my annual goal to possibly
12%, which is still a decent return.
I think the most important
objective to consider now, has to be NOT holding
shares for any length of time. As I live in Canada,
I would not want to hold RIM in my retirement (RRSP)
account for the simple fact that I cannot sell naked
options in my retirement account. The law prohibits
this. Therefore the only recourse would be to own
the shares and sell covered calls. I believe holding
the shares could be the ultimate risk in most of
these technology companies. I am far more
comfortable selling naked positions and holding
shares only when the positions dictate. (ie having
to turn a naked position into a covered position)
COMMENTS: NOW ONLY HOLDING 5 NAKED
PUTS MAY $68.00
34,000.00
Apr 16 10
72.86
STO 5 Naked Calls May $78.00 @ .80
1.0
13.25
386.75
14935.50
73,000.00
Apr 27 10
74.50
BTC 5 NP May 68 @ .39
(0.57)
13.25
208.25
14727.25
39,000.00
Apr 27 10
72.67
STO 5 NP Jun 68 @ 1.47
2.2
13.25
721.75
15449.00
73,000.00
MAY 10 2010: With the recent 1000 point sell
off, RIM has stumbled and hit the low point of its recent
trading range - $68.00, which I discussed April 16 (see
below). I have closed my May 78 naked calls and will wait
for a bounce to sell Jun Naked Calls.The
10 day SMA has crossed the 20-30 and 50 EMA. I
believe until RIM shows significant earnings growth
as well as a substantial increase in its client
base, it will remain stuck in a range unable to
break out higher.
May 10 10
68.44
BTC 5 Naked Calls May 78 @ .15
(0.19)
13.25
(88.25)
15360.75
34,000.00
May 11 10
70.04
STO 5 Naked Calls JUN 76 @ 1.00
1.4
13.25
486.75
15847.50
72,000.00
JUNE 1 2010: What a great pullback. We are
$10.00 below the 200 day moving average! The 10, 20 and 30
day are collapsing. The oscillator is showing no overbought
condition in almost 3 months but we have a bias toward
oversold, but still no overbought signal. With the stock
pulling back so hard, premiums are really up. I will roll my
Jun 68 puts as we get closer to expiration. Meanwhile I have
sold 5 naked puts for Jul 52. Imagine getting this great
stock at that level. Meanwhile on a bounce I will look to
sell some naked calls. I anticipate my Jun 76 naked calls
will expire based on this chart. For those who are more
daring than I, starting to accumulate some calls on RIM
might not be a bad idea, as this stock is sure to have a
significant bounce on any turn in the market.
Jun 1 10
62.27
STO 5 NP JUL 52 @ .92
1.7
13.25
446.75
16294.25
98,000.00
Jun 1 10
62.27
STO 5 NP JUN 56 @ .47
0.8
13.25
221.75
16516.00
126,000.00
Jun 1 10
62.27
BTC 5 NP JUN 68 @ 5.90
(8.6)
13.25
(2963.25)
13552.75
92,000.00
Jun 1 10
62.27
STO 5 Naked Calls JUN 70 @ 1.40
2.0
13.25
686.75
14239.50
127,000.00
JUNE 7 2010: With the news from Apple, RIM
sold off even further today. I am continuing to sell naked
calls. Many analysts were calling for RIM to hit 90.00 by
JUNE 2010. Obviously they have accumulated stock at levels
higher than where we are today. Meanwhile I bought to close
my JUN 68 Naked Puts on JUN1 and with today's sell off I
have sold the JUL 64 puts for almost the same value. This
moves me 4 dollars lower and keeps my profit hanging on. As
well on JUN 1 I sold 5 JUL 70 Naked Calls. This stock could
recover, but investor sentiment towards RIM's future must change in order for this
stock to recover. On the above chart you can see the
50 day moving average which is far above today's
price. The 200 day moving average is around 71.50.
If the stock can recapture the 200 day before my
July 70 calls expire, I can turn them into covered
calls through purchasing the stock. I have serious
doubts that RIM will do this any time soon.
Jun 7 10
60.54
STO 5 NP JUL 64 @ 6.00
(8.75)
13.25
2968.75
17208.25
159,000.00
JUNE 18 2010: The stock remains depressed. We
had a nice move back up to the 64 range a few days earlier
but the stock could not recapture the 200 day moving
average. The 10 day is moving further away from the 20 and
30 day. Premiums are leaving the call options, while the put
options are increasing slightly in value. The July 56 put is
over 1.00 today and the 54 is trading for .66 cents. I will
sell some 54 or even the 52 is the stock continues to move
lower. With the 200 day at the 71 strike, I have sold 5
naked calls for the 70. Should the stock reach there I will
be happy to purchase stock and turn it into a covered call.
Jun 18 10
62.72
Expiry: 5 Naked Calls Jun 76 expired
5 Naked Puts Jun 56 expired
5 Naked Calls Jun 70 expired
58,000.00
COMMENTS: Now only holding 5 Naked
Puts July 64 and 5 Naked Puts July 52
58,000.00
Jun 18 10
64.10
STO 5 Naked Calls Jul 70 @ 1.00
1.4
13.25
486.75
17695.00
93,000.00
Jun 23 10
62.40
STO 4 Naked Calls Aug 72 @ 1.06
Comments: Tomorrow earnings come out. I don't believe there
is anyway that RIM can bring out numbers that will jumpstart
the shares. They need perhaps a new product or a lot more
subscribers which means moving into emerging markets and
China. This will take time. RIM is still a great company,
but I am not convinced it will recover the highs for some
time to come, if ever.
1.5
12.00
413.25
18108.25
121,800.00
JUN 23 10
62.40
BTC 5 NP JUL 64 @ 4.10
(6.4)
13.25
(2063.25)
16045.00
89,800.00
JUNE 25 2010: This morning I sold RIM Aug 56
naked puts for 3.30, rather than do the July 62. I
had originally thought I would try to roll to July
62 for 4.20 and while I could get that amount, the
August 56 at 3.30 makes a compelling price. I also
sold 5 NP July 52 and 5 NP August 50.
The news from RIM was poor to say the least. In less
than a year RIM has seen 5 major declines, which I
have marked in RED. The stock is in serious trouble
and I have no long term interest in owning this stock.
Short term though it would not concern me at these
levels. The
announcement with yesterday's earnings that RIM will
repurchase shares only adds fuel to the fire-sale.
It is a sure sign that management wants a higher
price. Instead of buying shares in the market, why
not put together a small dividend or even better,
come to the marketplace with a brand new, hot
product that will regain some market share. Right
now Apple is the RIM killer and RIM needs to act
quickly to keep its customer database and grow it.
Many analysts are calling for RIM to increase its
profits through emerging markets like China, but
what's to stop Apple from moving in the same
direction? I believe the real issue is RIM had a
stranglehold on the market not because they were the
best, but because they were the only serious
provider. Now they finally have some competition and
its time for them to acknowledge it and fight back.
I have seen dozens of companies fall by the wayside
primarily as they are unprepared for a competitive
market. It's time for RIM to wake up to the
marketplace. Their decline in share price is the
warning sign. They still have the upper hand, but
Apple has moved from 10% market share in 2009 to 16
% this year.
For traders, day or otherwise, the stock is a
goldmine. Recent investment articles have pointed to
the large numbers of traders who are in and out of
the stock daily. My strategy of staying with the
10-20-30 moving averages continually points to a
stock in trouble. It has been unable to regain
upward momentum, so the easier movement is down. I
will stay with selling out of the money options. The
low of the stock back in March 2009 was around the
$45.50 price. I will not be surprised to see RIM
grind its way lower, but first there could be a
bounce in the stock and a chance to sell some more
naked calls.
JUN 25 10
56.04
STO 5 NP AUG 50 @ 1.20
2.4
13.25
586.75
16631.75
114,800.00
JUN 25 10
56.04
STO 5 NP JUL 52 @ .72
1.3
13.25
346.75
16978.50
140,800.00
JUN 25 10
56.04
STO 5 NP AUG 56 @ 3.30
Comments: I had originally planned to sell Jul 62 puts and
try to get 4.10 or 4.20. However with the rapid fall this
morning, I decided I would roll to Aug 56 and bring in 3.30
and wait to see if the stock can hold around this level. If
it does I will close this trade early for a profit. I am not
interested in holding this naked put to expiry as I think
the stock is in decline. See my comments below under JUNE 25
2010.
5.8
13.25
1636.75
18614.00
168,800.00
JUL 2 10
51.41
BTC 4 Naked Calls Aug 72 @ .05
(0.06)
12.00
(32.00)
18582.00
140,000.00
JUL 9 2010: Finally a little respect for RIM.
Today Rim bounced more than 7% so perhaps investors
have realized that RIM is not dead yet. It is though
in trouble and will need to move quickly now in
order to make sure that they do not lose more market
share. If you look at the previous selloffs, they
were followed up with a rise and then further
selling. Until the technicals tell me otherwise, I
think the safer side on RIM is probably selling
naked calls. Looking at the above chart, RIM has not
been above 66 since Mid May. I think though it could
rally into the low 60's. If the rally can continue
for a few more days I will start to sell out of the
money naked calls at or above the $66 strike. I will
be taking advantage of this rally in RIM to close my
July naked puts and I will look to the rally for an
opportunity to close my August 56 naked puts and
roll them down lower and then finally close them as
well.
Jul 15 10
57.89
STO 5 Naked Calls Aug 64 @ .73
1.1
13.25
351.75
18933.75
172,000.00
Jul 15 10
57.89
BTC 5 NP AUG 56 @ 1.84
Comments: This is a BTC of the JUN 25 sell of 5 naked puts
Aug 56. I am going to roll this over the next day or two, down
to 54 or reduce the number of contracts.
COMMENTS: Now only holding 5 Naked
Calls Aug 64 and 5 Naked Puts August 50.
Jul 16 10
55.41
STO 5 Naked Puts AUG 54 @ 1.97
Comments: This is the roll of the naked puts of June 25
where I sold 5 Naked Puts Aug 56.
3.6
13.25
971.75
18972.25
84,000.00
Jul 28 10
57.68
BTC 5 NP AUG 50 @ .29
(0.58)
13.25
(158.25)
18814.00
59,000.00
JUL 29 2010: Lots of news both good and bad
for RIM, has kept the stock from falling and from rising.
The chart looks a little better for RIM. The MACD though
shows a possible recovery underway. The 10 day needs to
cross the 30 to confirm a the uptrend. There is still enough
premium is both my naked calls and puts that I will consider
not closing for a few more days.
Jul 30 10
59.00
BTC 5 Naked Puts Aug 54 @ .53
(0.98)
13.25
(278.25)
18535.75
32,000.00
Jul 30 10
59.00
STO 5 Naked Calls Sep 68 @ .99
1.4
13.25
481.75
19017.50
66,000.00
Aug 4 2010:
RIM just announced their new
TORCH phone to compete with APPLE IPHONE and now bad
news from the middle east and possibly India
regarding encryption of emails and their respective
governments not being able to access those emails
for security reasons. The stock had a nice move
higher by July 30 and looked like it might get into
the low 60's. I wasn't so sure but September option
premium sure seemed to be convinced so I sold 5
naked calls for Sept at 68.00. Today though I closed
the naked calls as they are up more than 1% for just
a few days. This frees me up to sell more calls once
the stock bounces back up.
Meanwhile here we are just a few days later and the
stock is down more than 10%. I think this is way
overdone as RIM earns less than 1% of its total
earnings from the Middle East. Meanwhile I have sold
5 naked puts for Sept at 48.00. Looking at today's
chart, you can see that that low back in July was
$50.06, which is why I sold the Sept $48, which
would be a new low for RIM and I think offers some
nice downside protection. The chart where I have
circled, shows that the 10 day was crossing the 10
and almost ready to cross the 30 when the news from
the Middle East came out. Looking at MACD, the mood
had turned positive on the stock until yesterday and
today. My hunch is that the stock will recover and
go sideways for a bit. Once confidence returns I
think the stock could climb back up.
Aug 4 10
54.30
STO 5 Naked Puts Sep 48 @ 1.28
COMMENTS: See my chart below for Aug 4 2010
2.6
13.25
626.75
19644.25
90,000
Aug 4 10
54.30
BTC 5 Naked Calls Sep 68 @ .36
Comments: I closed this within just a few days. Making about
1% is just a few days is worth closing. This gives me
another chance to sell calls when the stock bounces back.
(0.52)
13.25
(166.75)
19477.50
56,000
Aug 11 10
58.70
BTC 5 Naked Calls Aug 64 @ .18
(0.28)
(103.25)
19374.25
24,000
COMMENTS: Now only holding 5 Naked
Puts Sep 48
Aug 11 10
58.70
STO 5 Naked Calls Sep 66 @ 1.01
Comments: This is an easy trade. The stock is up on good
news that RIM will allow the Saudi government to get access
to encrypted messages. But overall the stock is in a
downtrend and until that changes it is worthwhile to sell
naked calls. The Aug 64 was as easy buy back and now I can
roll higher for September on today's news. I have moved to
the $66 call strike.
1.5
13.25
491.75
19866.00
57,000
Aug 30 2010:
The
10-20-30 day continues to show that the stock is in
a decline. The only positive news here is that the
stock appears oversold and has set a new 52 week low
several times over the past few trading sessions.
RIM has lost 50% of its value in the past 12 months.
Last August I was selling Sept 90 Naked Calls on RIM
and in June 2009 I was selling July 100 calls. Go
through the above trades and you can see the carnage
RIM has dumped on shareholders. Imagine buy and
holders of this stock. What a disaster. I wouldn't
even want to average down on this stock and try to
make my way out of it that way. No, the only way to
make money on RIM has been for day traders and
option traders. The company is definitely in
trouble. That said if the stock falls below 48.00, I
will be buying back my naked puts, even if there is
a loss on the position. I am not interested in
holding this stock at any level until RIM can prove
that it has bottomed out. RIM continues to make
excellent profits, but the perception is that RIM is
behind the times now and it is continuing to lose
market share in an environment that it use to own.
There are more players in the RIM sandbox now and
they have been "kicking sand" in RIM's face
throughout this year.
Looking at the 10-20-30 averages the warning here is
that the stock could move even lower. Meanwhile
though I will be closing my Sept 66 calls, but I am
reluctant to sell Oct 58 calls for a few more days
just to be sure the stock doesn't race back up. That
will be the time to sell the naked calls. Today RIm
is having a little bounce so I will be buying my
naked puts back shortly. The naked calls though will
have to wait a few days to see how much the stock
bounces.
Sep 9 2010:
COULD RIM FALL TO $38.00 THIS YEAR? RIM
continues in a serious decline and news today was
again bad, but the stock held on throughout the day.
Today analysts have downgraded the stock to $38.00
for the year and expect the stock to continue to see
market share erosion and further declines in 2011.
However RIM’s earnings have remained strong and do
not reflect an “end of the world” scenario just yet.
Meanwhile premiums for the call options are
decreasing. It would be dangerous at this point to
sell naked calls. A serious rally could easily move
the stock price back up to $57.00 and I have no
interest in owning this stock. I believe the prudent
thing to do is to strictly stay with the 10-20-30
rule and only sell the calls after the next rally
and when the 10-20-30 shows the stock is moving
lower. The same with more naked puts. When the rule
shows the stock is turning up, then I will sell
naked puts.
Below is a chart of the past 5 years. The
stock is challenging its 2008 low which was $44.23
on Dec 3 2008. What is the likelihood that RIM could
see $38.00? Looking back at the past 5 years, RIM
traded between 38 to 55 from Sept 06 to May 2007 and
then the move higher commenced. But RIM was the only
player in its market and as subscribers grew the
stock split on Aug 15 2007 for 3:1 and then share
values moved much higher, probably very overdone by
investor enthusiasm. Analysts continued to upgrade
RIM even when it was over $140.
Could RIM see the lofty heights of 2008 again?
Things have changed a great deal in a very short
period of time. RIM now has major competitors who
have very interesting product lineups. They offer
many features that RIM does not offer. RIM though
has valuable encryption technology which none of the
competitors have as of yet. My present view is that
I would not want to own this stock. I believe RIM
has a much better chance of seeing $38.00 or even
lower, than it does $140.00. I will be following the
10-20-30 rule from here on in when selling calls and
puts on RIM.
Sep 17 10
49.90
BTC 5 NP SEP 48 @ .10
-
13.25
(63.25)
19802.75
33000.00
Sep 17 10
47.78
Expiry 5 NC Sep 66 expired
0.00
Sep 17 10
COMMENTS: At this point I
have done very well with RIM but I am putting this trade on
hold until I get a better direction as to whether or not RIM
can remain a viable candidate for option selling following
the 10-20-30 rule. Premiums are decreasing for RIM options
when I go further out of the money than a couple of strikes.
I'll watch it for now and see what develops.
Nov 3 10
56.60
STO 6 NC Dec 64 @ .97
1.5
14.50
567.50
20370.25
38400.00
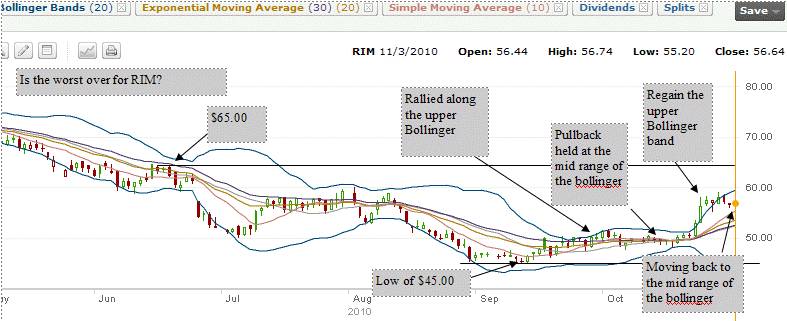
Nov 3 2010: I
moved back into RIM today after being out for about a month
and a half. I wanted the stock to find a new base, which it
did around the 46 - 48 level. From there it has twice tried
to rally and each rally has moved higher than the previous,
a good sign. Both rallies fell back to the mid-range of the
Bollinger band, but did not fall to the low end of the
range. The rally was better than 21% and could mean the easy
move higher is over for now. Whether or not the stock can
rally to $64 by December is somewhat doubtful. I think it is
a good strike to sell naked calls at. Meanwhile if the stock
rises and can hold in the mid 60's I might consider rolling
rather than purchase shares. RIM is a tough call and I think
the chance of it regaining loftier heights is limited.
Nonetheless, stocks can surprise you and RIM being so
oversold may have more upside. Remember that at 56.67 it is
only trading at 10.37X earnings. This stock could very well
surprise to the upside.
Nov 9 10
55.40
STO 5 Naked Puts Dec $50.00 @ 1.07
2.1%
13.25
521.75
20892.00
63,400.00
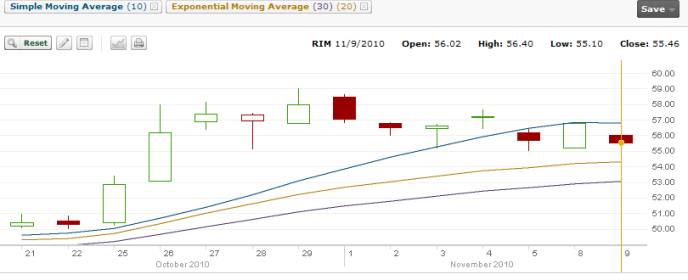
Nov 9 2010: The
stock has been moving up and now this sideways pattern is
emerging. However the 10 day is widening from the 20 and 30
which would indicate that there is still more upside to
come. I am selling naked puts today with the move down by
$1.30.
Dec 17 10
60.69
Expiry: 5 Naked Puts Dec 50 Expired
6 Naked Calls Dec 64 expired
0.00
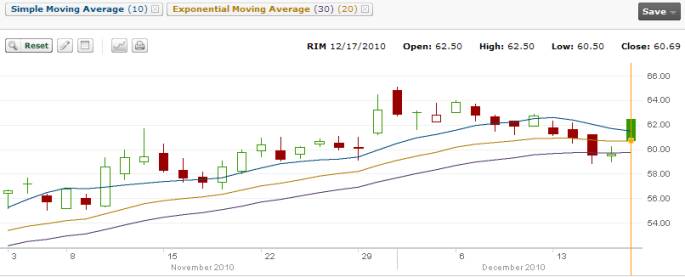
Dec 17 2010: The
10 day has definitely turned and even with today's up swing,
the trend is down. The stock opened at a high of $62.50 and
then fell throughout the day to close almost on the low. I
sold naked calls today.
Dec 17 10
61.50
STO 5 Naked Calls Jan 64 @ 1.45
2.2%
13.25
711.75
21603.75
32,000.00
End of 2010 - Income
$12,533.25 = 39%
STRATEGY SUMMARY: This
year the returns were terrific. At one point the stock
became less volatile making the option premiums poor, but
this was short lived. A gain of 39% in one year gives me a
lot of confidence that the 10-20-30 moving averages strategy
holds merit for my trades. While I realize that I cannot
just blindly rely on the 10-20-30 strategy, it was obvious
this year that moving averages assisted greatly in my
knowing when to sell and buy my option positions.