|
 |
 |
 |
 |
 |
 |
 |
 |
 |
 |
Capital
Committed |
|
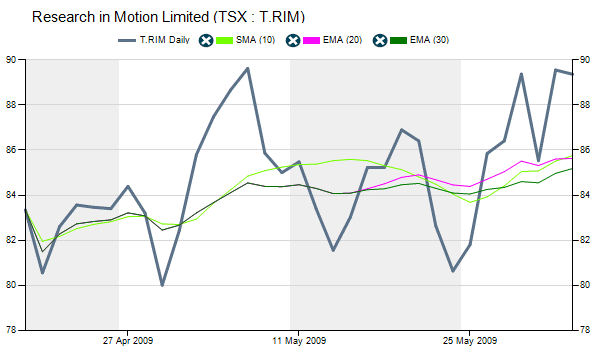
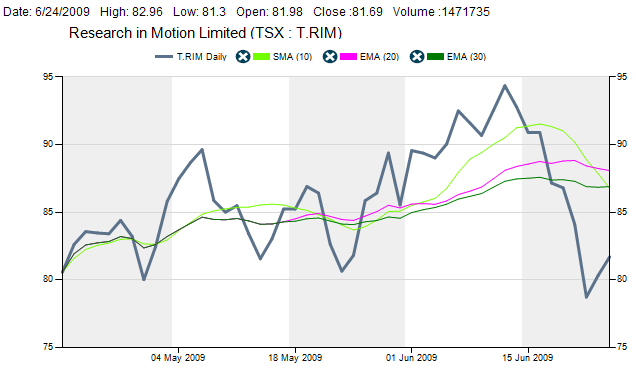
JUNE 2 2009:
The 10 day SMA has crossed the 30 day and now the 20 day
EMA. I have sold
5 naked puts Jun 80 for $1.50.
 |
| Jun 2 09 |
89.37 |
STO Sold 5 Naked Puts
Jun 80 @ 1.50 |
1.87 |
0 |
|
13.25 |
0 |
0 |
736.75 |
736.75 |
40,000.00 |
|
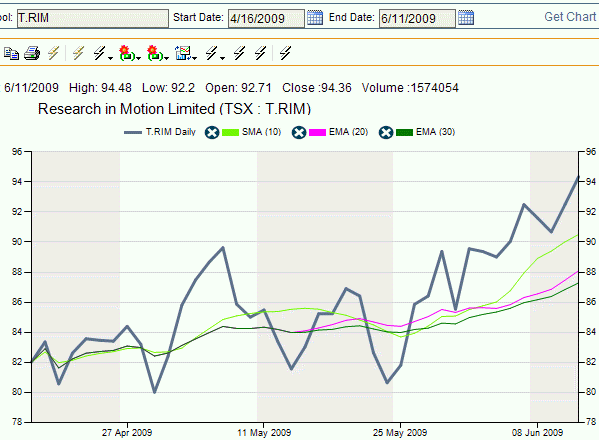
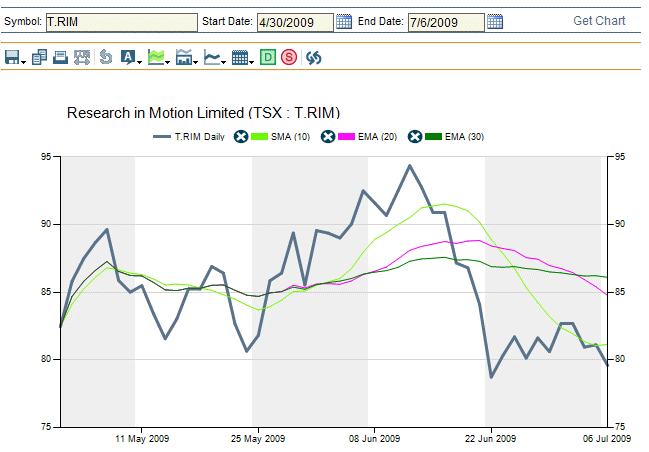
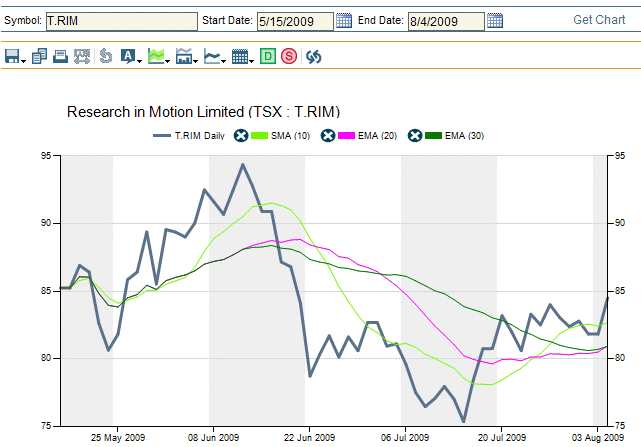
JUNE 11 2009: The stock has hit over 94.00 during
the day. My Put is at .45 big .51 ask. I bought back my put for .51
cents. Why cover here you may ask. The gain is over
60% in just a few days. Look at the chart below.
 |
|
|
|
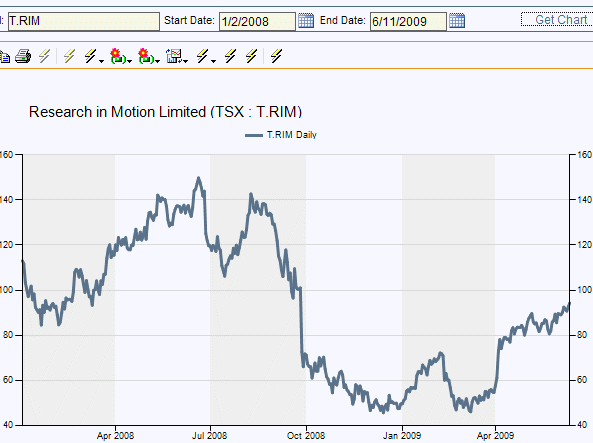
JUNE 11 2009: Here is RIM from Jan 2 2008 until Jun
11 2009. This stock is extremely volatile. During the rush
to get into stocks it was pushed beyond normal valuation as
were most stocks. There is reasonable support for the stock
at just above 80.00, but resistance is anywhere above 90.00.
I have many friends who bought into this stock at and above
100.00. They are waiting to get out. The concept here for me
is to make a profit. A gain of more than 60% in a few days
is great for my needs.
 |
| Jun 11 09 |
94.24 |
BTC Bought back 5 Naked Puts Jun 80 @ .51 |
(.64) |
0 |
|
13.25 |
0 |
0 |
(268.25) |
468.50 |
0.00 |
|
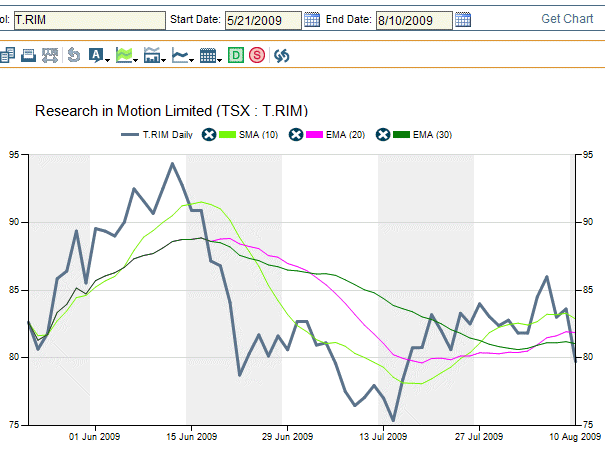
JUNE 15 2009: Even though the stock has pulled back
in the last few days, the 10 day SMA is far above the 20 and
30 day EMA. I am however going to sell 5 Jun 100 naked
Calls @ 1.91. There is just 4 days left to
expiration.
 |
| Jun 15 09 |
90.90 |
STO Sold 5 Naked Calls Jun 100 @ 1.91 |
1.9 |
|
|
13.25 |
|
|
941.75 |
1410.25 |
50,000 |
| Jun 19 09 |
84.10 |
Expiration Day Jun 100 Calls Expired |
|
|
|
|
|
|
|
|
0.00 |
|
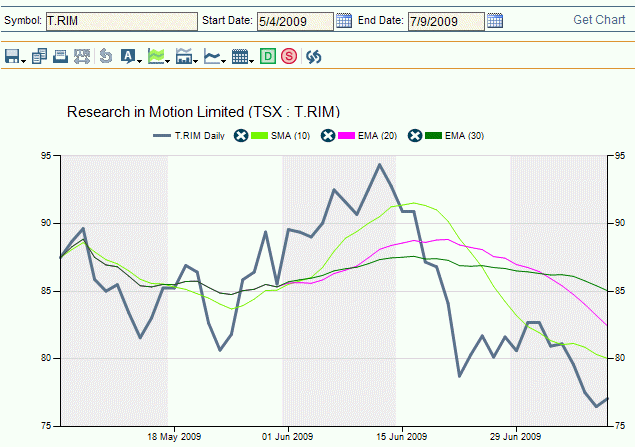
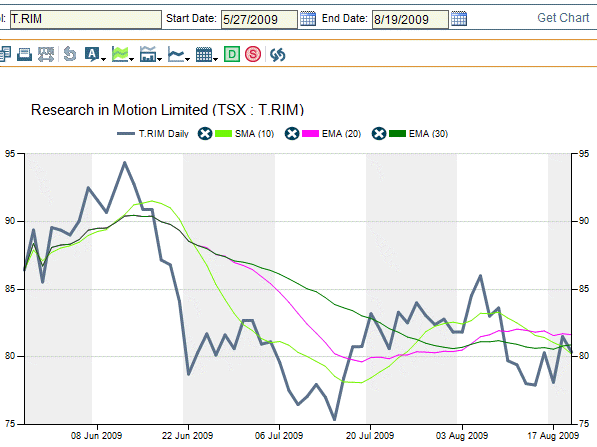
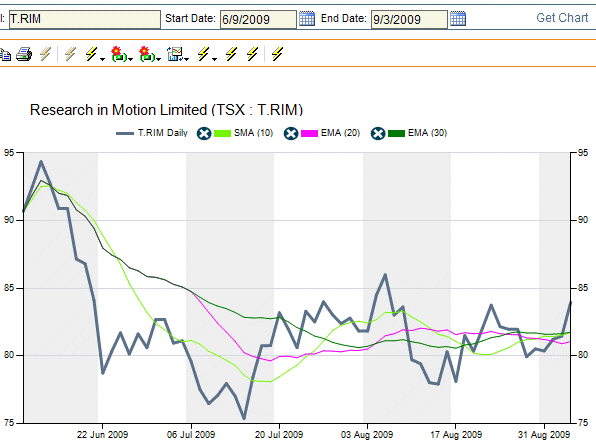
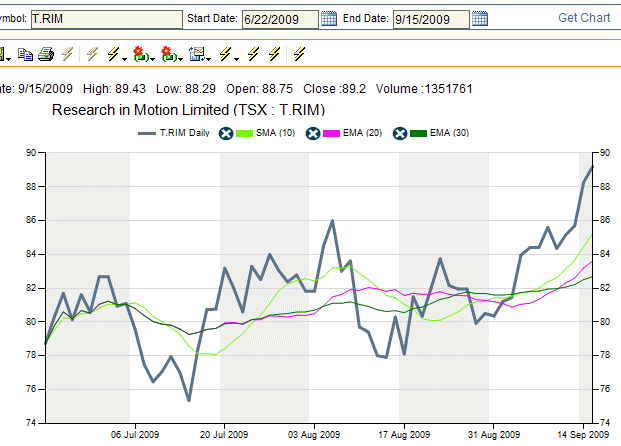
JUNE 24 2009: The 10 day has crossed the 20 day and
is touching the 30 day EMA. The stock has bounced up a
little in the last couple of days. A good day to do nothing.
 |
|
|
|
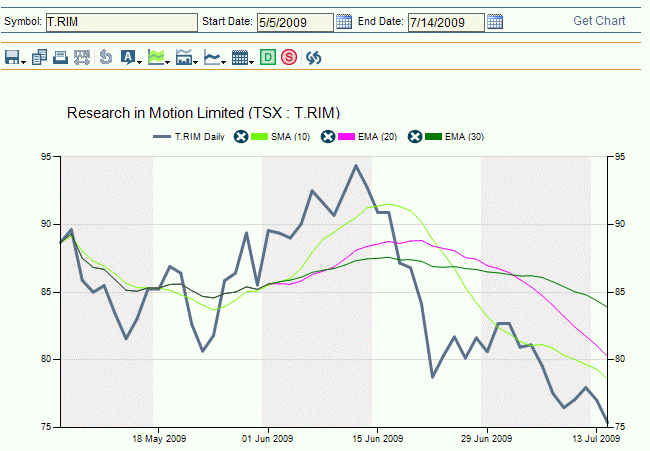
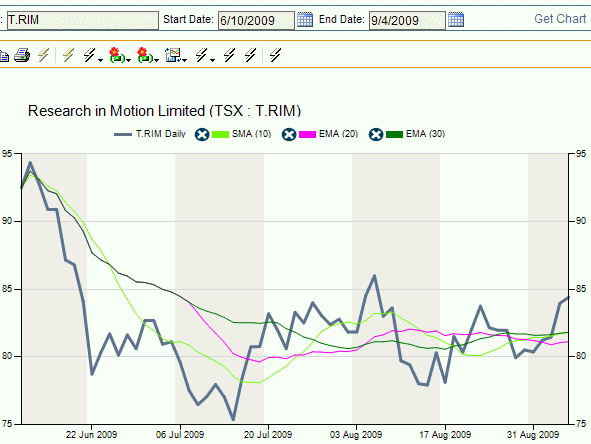
JUL 6 2009: The 10 day is starting to flatten out.
The 20 day EMA has cross the 30 day EMA. Still doing
nothing, but getting ready to sell Naked Puts or possibly
buy Calls.
 |
|
|
|
JUL 9 2009: The 10 day EMA has slowed its descent
while the 20 day EMA is falling toward the 80 dollar mark.
The 30 day has only moved a dollar or so. Still doing
nothing.
 |
|
|
|
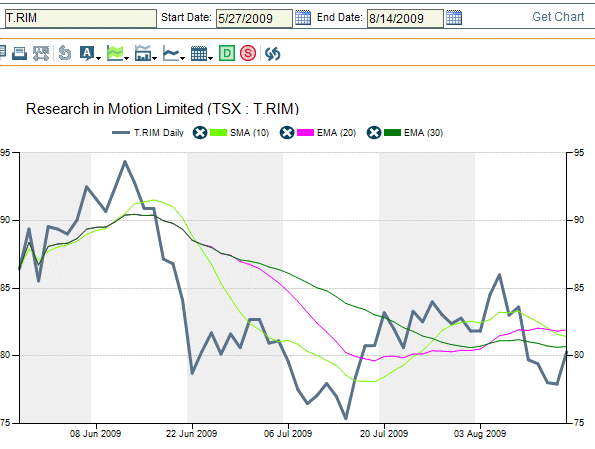
JUL 14 2009: Good thing I waited for confirmation.
Stock is now lower and the 30 day EMA is moving lower. The
20 day EMA is down to 80.00 and now the 10 day EMA is below
80.00. Still doing nothing. Should have bought some puts
back on Jul 6. If you look at the chart above you can see
that the 10-20-30 rule indicated this stock was moving
lower. I though prefer shorting the options rather than
buying them.
 |
|
|
|
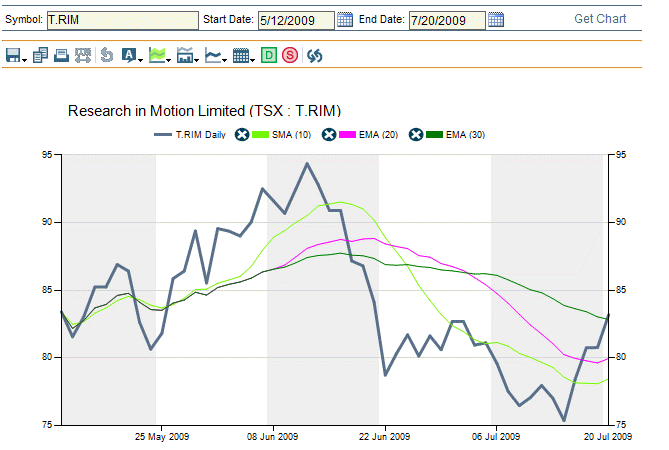
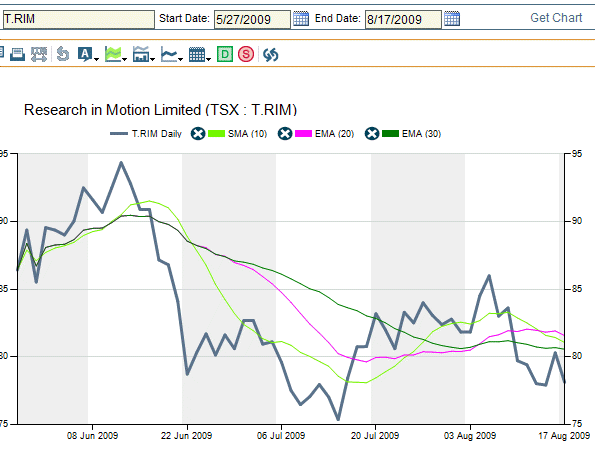
JUL 20 2009: If you are a bit of a risk taker you
could consider buying a call or selling a put, but there is
no confirmation yet but everything is turning back up. I am
waiting though.
 |
|
|
|
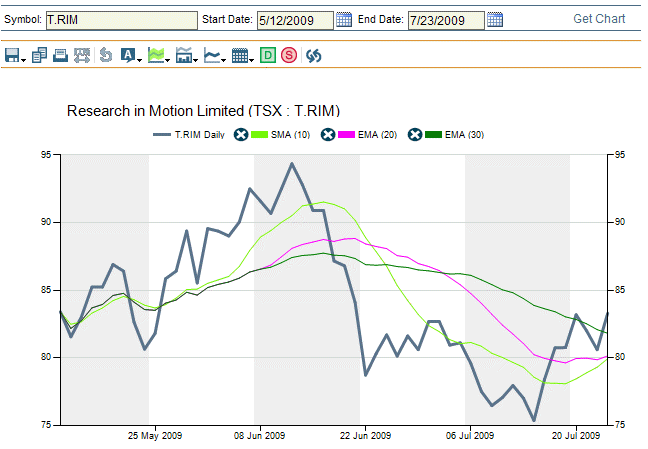
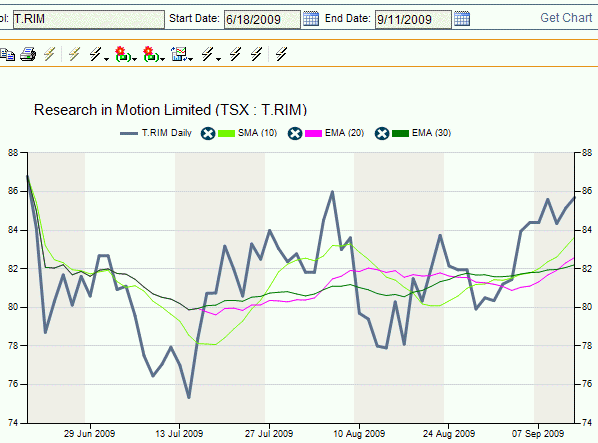
JUL 23 2009: 10 day almost touching the 20 day and
still moving higher. Stock is trending sideways though
trying to find a direction.
 |
|
|
|
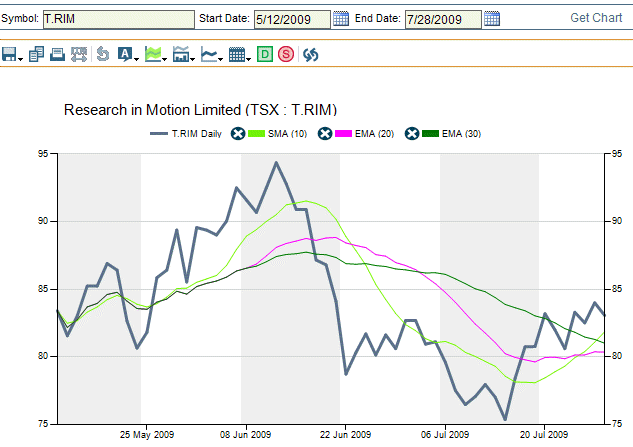
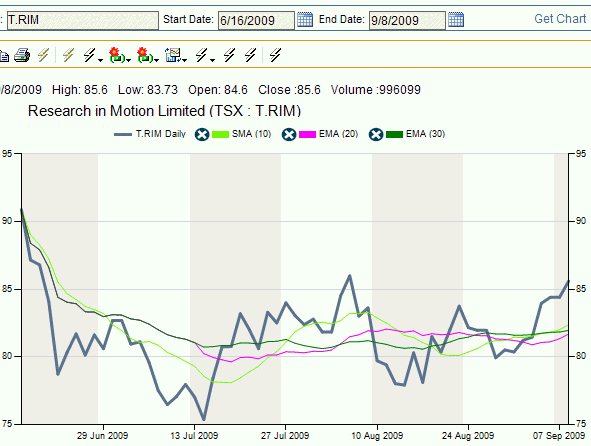
JUL 28 2009: 10 day SMA has crossed 20 and 30 DAY
EMA confirming an uptrend. Could consider buying a call. But I sold 5 Naked Puts Aug 76 @
.84 instead. Note I am always staying OTM both on
the put and call side. Yes the premiums are higher
for ATM or closer OTM but this is a volatile stock.
I want to turn a profit and not have to worry about
owning or buying shares.
 |
| Jul 28 09 |
83.55 |
STO Sold 5 Naked Puts Aug 76 @ .84 |
1.10 |
0 |
|
13.25 |
0 |
0 |
406.75 |
1817.00 |
38,000.00 |
|
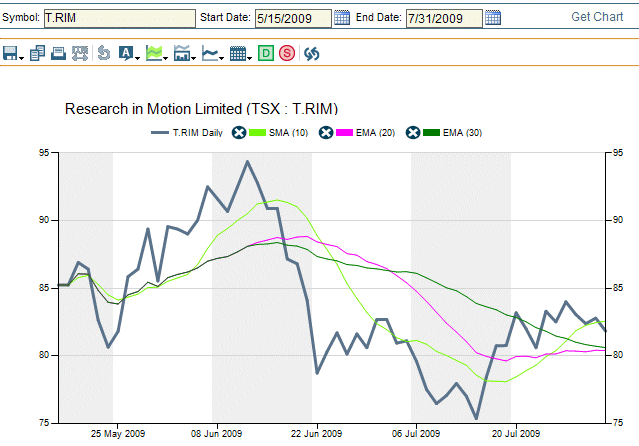
JUL 31 2009: The 10 day SMA is flattening out. Was
it a wrong call. The stock is trending sideways. Perhaps
there will not be a breakout. My put has gone no where. I
will wait a bit longer. As I sold August, each day means a
bit more evaporation of the premium in my favor.
 |
|
|
|
AUG 4 2009: The stock is moving higher. 10 day is
starting to turn higher as well.
 |
|
|
|
AUG 11 2009: Uh Oh are we in for more selling? The
10 day SMA is turning down. To get out of the Naked Put - Aug 76 - will cost me .84
cents. I think I will hang on. If I get assigned
I don't mind $76.00. It's on the low side of the
stock price.
 |
|
|
|
AUG 14 2009:
The 10 day SMA
has crossed the 20 day SMA and the 30 day EMA is moving
lower. The stock though has a bit of a bounce. Is it time to
get out? My Aug 76 Put is at .41.
The 30 day EMA though is not moving lower as is the
20 day EMA. Just 1 week to go. Let's see if I get
assigned.
 |
|
|
|
AUG 17 2009: Stock at $78.10. 10 day SMA still
turning lower as is the stock but the 10 day has still not
crossed the 30 day EMA. The 30 day EMA is also not falling
lower. Just 2 days left.
 |
|
|
AUG 19 2009:
The 10 Day SMA
has crossed the 20 and 30 day EMA. This is expiration day.
My Aug $76.00 puts expired.
I sold Naked Calls. 5 Contracts Sep 90 @ 1.27
 |
| Aug 19 09 |
80.33 |
Expiration Day Aug 76 Puts Expired |
|
|
|
|
|
|
|
|
0.00 |
| Aug 19 09 |
80.45 |
STO Sold 5 Naked Calls Sep 90 @ 1.27 |
1.41 |
|
|
13.25 |
|
|
621.75 |
2438.75 |
45,000.00 |
|
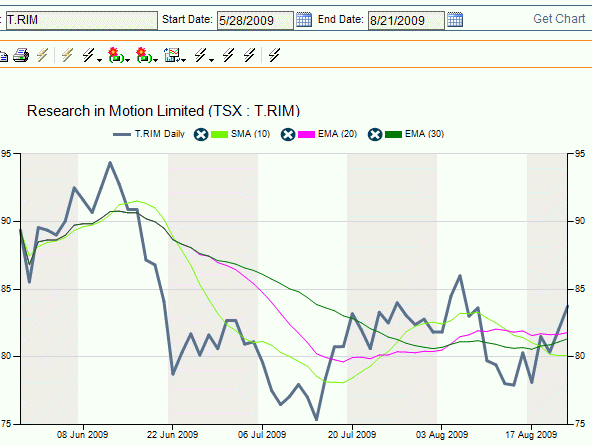
AUG 21 2009: The stock has moved higher and the 10
day SMA has turned flat. What do you think? Sell some Naked
Puts and buy back my call? I think I will wait a bit longer.
 |
|
|
|
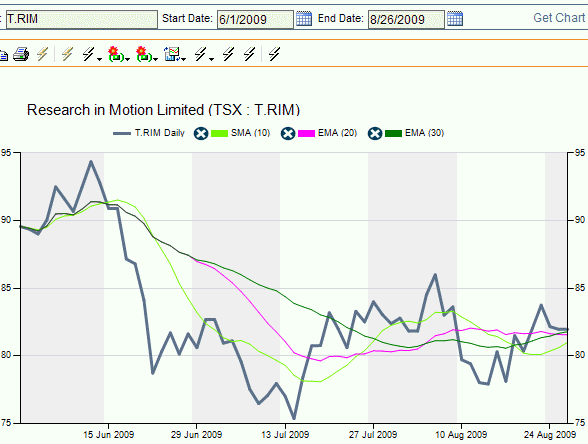
AUG 26 2009: The 10 day is moving up and the 30 day
EMA has crossed the 20 day EMA. The stock though appears
flat. Still holding my Naked Calls. Remember they are Sep
$90.00
 |
|
|
|
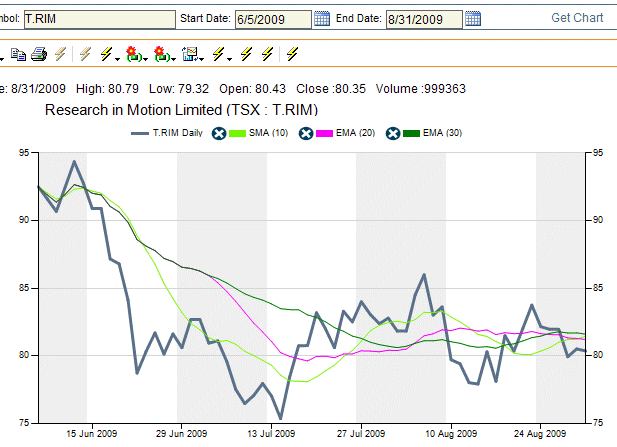
AUG 31 2009: Here we are at the end of Aug and the
10 day has just crossed the 20 day, but the stock is still
flat. My Sep 90.00 Calls are trading at .46 cents to buy
them back. I'll wait.
 |
|
|
|
SEP 3 2009: The stock is up, but the 10 day SMA has
just finally touched the 30 day but not crossed it. The 20
day EMA is turning up.
 |
|
|
|
SEP 4 2009: 10 day SMA refuses to cross the 30 day
EMA and the 20 day EMA is flattening out. Stock is up
slightly.
 |
|
|
|
SEP 8 2009: I
finally got my confirmation. Time to sell 5 Naked Puts and buy back my
Sep 90 Call for .50.
The problem is there is no premium left in September
for OTM worth the risk. I will wait a day or so.
(Next day - Sep 9 - I sell 5 Oct 76 @ 1.99)
 |
| Sep 08 09 |
85.60 |
BTC Bought back 5 Naked Calls Sep 90 @ .50 |
(.55) |
|
|
13.25 |
|
|
(263.25) |
2175.50 |
0.00 |
| Sep 09 09 |
84.35 |
STO Sold 5 Naked Puts Oct 76 @ 1.99 |
2.61 |
|
|
13.25 |
|
|
981.75 |
3157.25 |
38,000.00 |
|
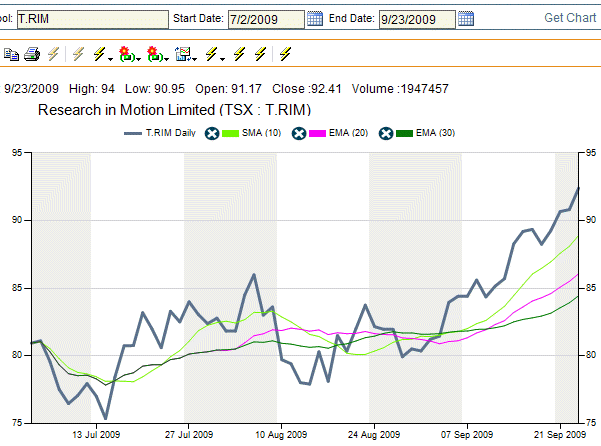
SEP 11 2009: 20 day EMA crosses the 30 day EMA.
Stock continues its climb.
 |
|
|
|
SEP 15 2009: Stock continues climbing as does the 10
day SMA and 20 day EMA. Now the 30 day EMA is moving higher.
 |
|
|
|
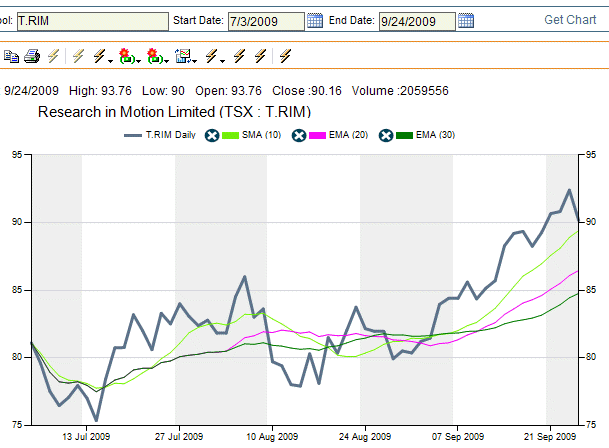
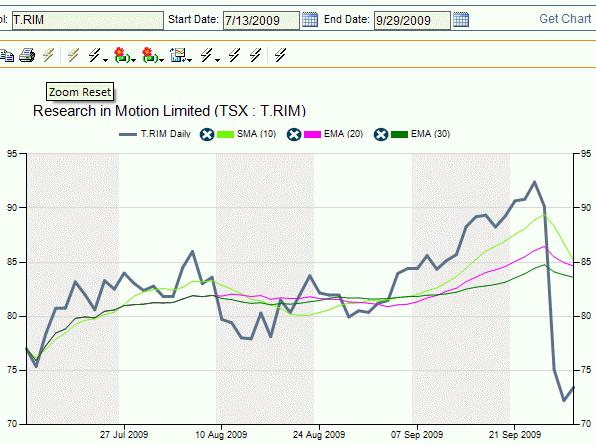
SEP 23 2009: Wow - we are up to a high of 94 during
the day. So here we are again. All the indicators point up
and up and the 30 day EMA is getting up to 85.00. My Oct 76
put is trading for
.50 cents. I buy the puts to close the trade.
What a great trade this has been. The Oct Call
$105.00 is at 1.26 bid. I might wait a day or so and
sell that call. I doubt we see 100.00 on the stock.
 |
| Sep 23 09 |
94.00 |
BTC Bought back 5 Naked Puts Oct 76 @ .50 |
(.65) |
|
|
13.25 |
|
|
(263.25) |
2894.00 |
0.00 |
|
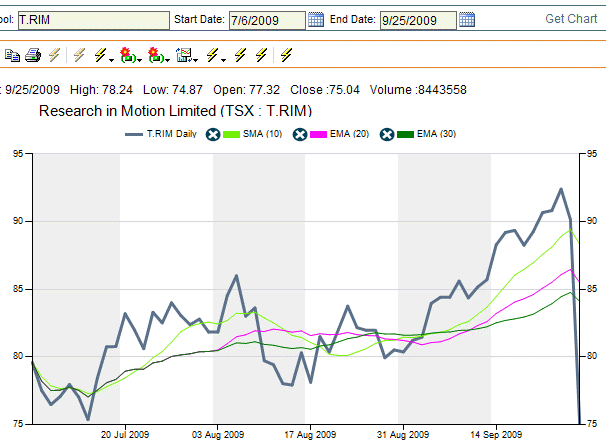
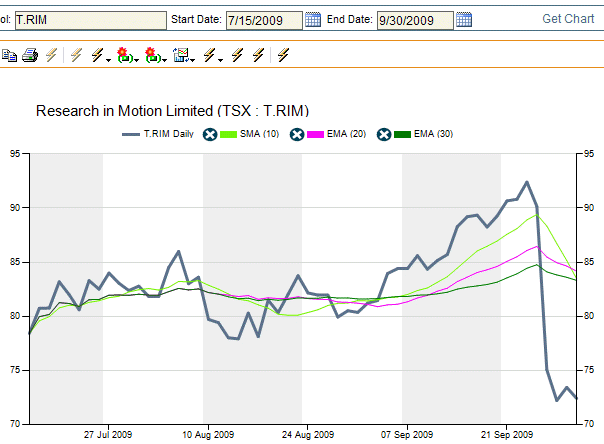
SEP 24 2009:
The stock fell
$4.00 today. I really think the chance of this stock getting
to 105.00 is limited. Not to out think the 10-20-30 rule but I sold the Oct 105.00 for 1.12.
I have enough profit that if I am wrong I will buy
back the calls and sell some puts. I think I am
right after reviewing the yearly chart. Sometimes yo
have to look beyond the 10-20-30 rule and do what
your instincts tell you. Plus I have a lot of
friends who want to sell at $100.00 and get out. I
really think $100.00 is going to be tough for this
stock to reach and hold.
 |
| Sep 24 09 |
90.16 |
STO Sold 5 Naked Calls Oct 105.00 @ 1.21 |
1.15 |
|
|
13.25 |
|
|
591.75 |
3485.75 |
52,500.00 |
|
SEP 25 2009: What a difference a day can make. We
are down to 75.04. Didn't even get a chance to buy a put.
Even the 10-20-30 rule could not warn me. Poor earnings
report and a couple of downgrades and here is what can
happen. This is why I prefer corporations that pay a
dividend and have slow but steady earnings. No surprises is
what I like. But then the volatility is much lower and
premiums are nothing like those we have made on RIM. Still
though this is way over dong it. I will get a chance to sell
naked puts soon I bet.
 |
|
|
|
SEP 29 2009: A small bounce, but nothing really. The
10-20-30 rule is a bit out of sorts right now, as it tries
to re-establish itself.
 |
|
|
|
SEP 30 2009: Now we get the 10-20-30 rule back
working. The 10 day SMA is crossing the 20 day EMA and
touches the 30 day EMA - Time to sell a Naked Call? Too
early I think after such a dramatic fall.
 |
|
|
|
OCT 2 2009: The confirmation is now solid. The
problem is I have already sold my Naked Calls and there are
just no decent premiums unless I want to risk a bounce back
up in the stock. I think a move higher is in the cards.
Instead my Oct 105.00 Naked Calls are trading for .15 cents.
I will buy them back. Why would I do this. It closes the
trade, the profit is enormous and I can concentrate on
putting my capital to work for the next trade on RIM. Do I
think they will expire worthless. Absolutely! But I like to close the trade and
for .15 cents -why not.
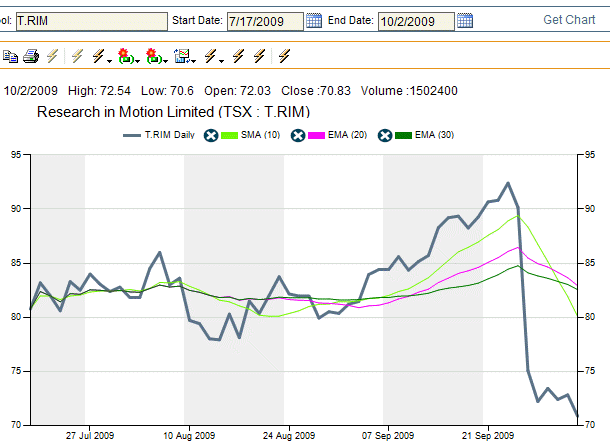 |
| Oct 02 09 |
70.83 |
BTC Bought back 5 Naked calls Oct 105 @ .15 |
(.14) |
|
|
13.25 |
|
|
88.25 |
3397.50 |
0.00 |
|
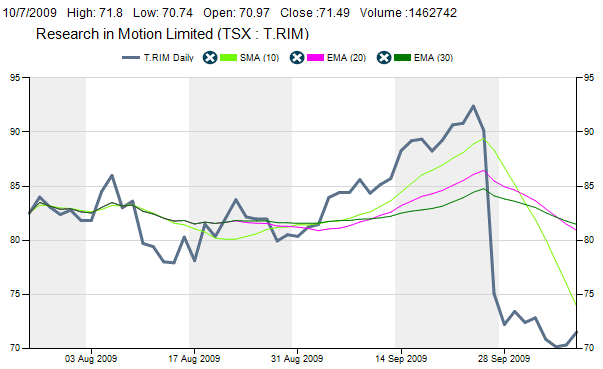
OCT 7 2009: The 10 day SMA has fallen below 75.00
and the 20 and 30 day are down as well. The problem I see is
that we could go back to at least 80.00 in the short term as
the selloff was definitely overdone. I will wait a few days
I think before deciding whether or not to sell naked calls.
With today's move the stock closed at 71.49 which is a 1.46%
increase.
 |
|
|
|
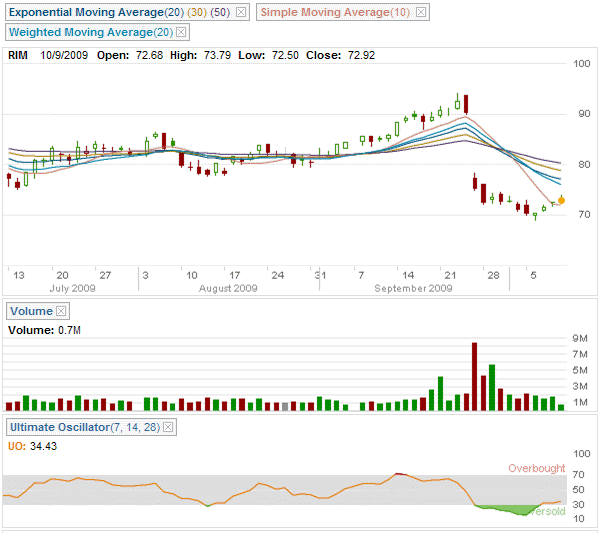
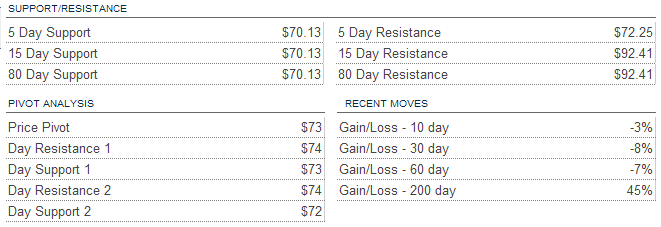
OCT 9 2009:
The 10-2030 rule
shows a stock very much under pressure. I have added a few other
technical indicators. The 50 day EMA and the 20 day
WMA. The 10 day has broken through all these levels.
However the Oscillator shows an oversold condition.
As well the Support/Resistance show 80 day support
still at 70.13 so even in the recent sell off the
stock did not break support. So what would be best
to do at this stage. As I am unsure the direction, I will sell an OTM Naked Call and
Put . As I am unconcerned long term on this
stock I would be willing to own this stock at either
of these levels. For those investors who are
concerned, I would suggest purchasing a farther OTM
Call and Put for protection. (Create bull/bear
spreads). For a put I will pick 64.00 which is 6
dollars below the 80 day support. For the call I
will choose the 85.00 strike which I think is far
enough OTM that it will not recover to that level by
Nov expiry.
 |
| Oct 09 09 |
72.98 |
STO Sold 5 Naked Calls Nov 85 @ .66 |
.77 |
|
|
13.25 |
|
|
316.75 |
3714.25 |
42,500.00 |
| Oct 09 09 |
72.98 |
STO Sold 5 Naked Puts Nov 64 @ .69 |
1.07 |
|
|
13.25 |
|
|
331.75 |
4046.00 |
74,500.00 |
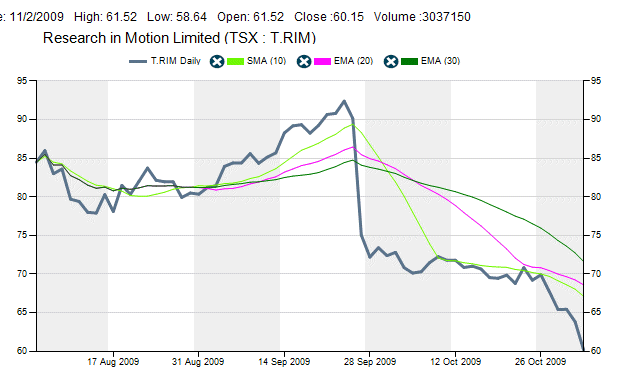
OCT 28 2009:
The 10-20-30
continues to show a stock in serious decline. Obviously I
should have listened to what the 10-20-30 rule was telling
me. My naked calls are doing very well but my $64.00 put is
under pressure. I have
today bought back the Naked Puts for Nov 64 and
rolled them to Dec 60.00 and I have sold an
additional 5 Naked Calls for Dec 80.00.
 |
| Oct 28 09 |
65.65 |
STO Sold 5 Naked Calls Dec 80 @ .93 |
1.16 |
|
|
13.25 |
|
|
451.75 |
4497.75 |
114,500.00 |
| Oct28 09 |
65.65 |
BTC Bought back 5 Naked Puts Nov 64 @ 1.84 |
(2.8) |
|
|
13.25 |
|
|
(933.25) |
3564.50 |
82,500.00 |
| Oct 28 09 |
65.65 |
STO Sold 5 Naked Puts Dec 60 @ 2.07 |
1.72 |
|
|
13.25 |
|
|
1021.75 |
4586.25 |
112,500.00 |
NOV 2 2009: Today Citigroup issuing a sell
recommendation on RIM, the stock fell dramatically. Yet by
the close of the day the support held at 60.00. The 10-20-30
is telling me that that stock is still in decline.
The move I should make is to continue to have sold
naked calls but never have sold the naked puts. We
will see if RIM can hold onto support here. If not I
will probably roll my naked puts lower or go out
further to bring in more premium.
|
| Nov 2 09 |
59.14 |
STO Sold 5 Naked Calls Dec 68 @ 1.75 |
2.57 |
|
|
13.25 |
|
|
861.75 |
5448.00 |
146,500.00 |
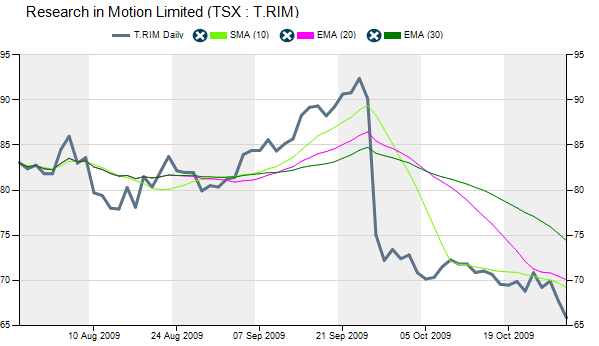
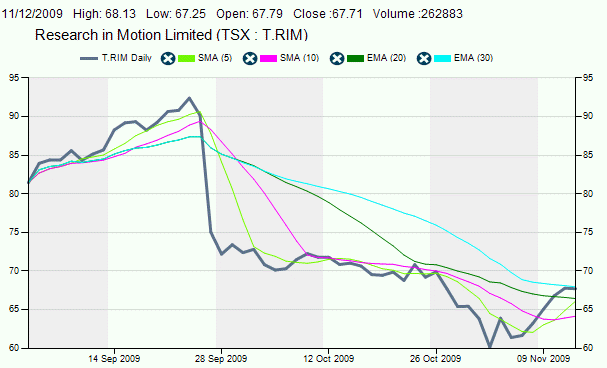
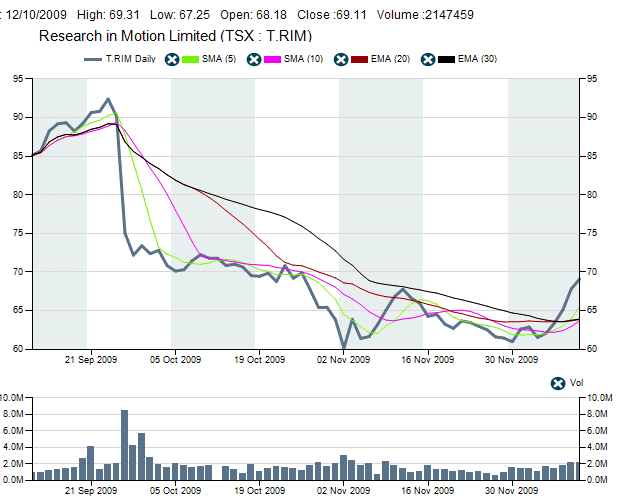
NOV 12 2009:
Rim has moved up significantly but the 10 day still
shows stock is not recovering but moving sideways.
This could mean the new trend is sideways. My Dec 68
calls are on the verge of being ITM. I have added
the 5 day SMA to give us a better idea of the short
tern trend and we can see that it is definitely up
with the 5 day touching the 20 day. I am holding the
Dec 68 Calls. Should the stock hold above 69.00 I
will purchase 500 shares, so my Dec 68 calls will be
covered.
 |
| Nov 20 09 |
63.66 |
Expiry: 5 Naked Calls Nov 85 expired |
|
|
|
|
|
|
|
|
104,000.00 |
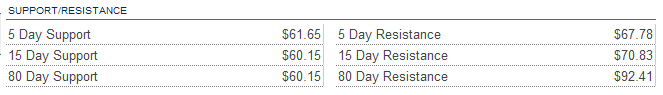
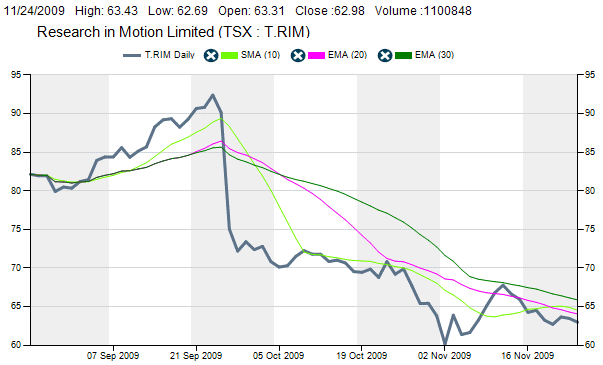
NOV 24 2009:
The 10 day SMA
crossed the 20 day and is now turning back down. The trend
remains sideways to down. Resistance for 15 day is at 67.78
and support remains at 60.00, right where our Dec short put
is.
For this stock to recover in the next 4 weeks to
80.00 will require a significant change. I will
watch and BTC the Dec 80 when the premium falls
below .15 cents or so. However as the indicators
still point down, I want to gather more premium and
I have sold 5 Jan 76 strike at .85.
 |
| Nov 24 09 |
62.98 |
STO 5 Naked Calls Jan 76 @ .85 |
1.14 |
|
|
13.25 |
|
|
411.75 |
5859.75 |
142,000.00 |
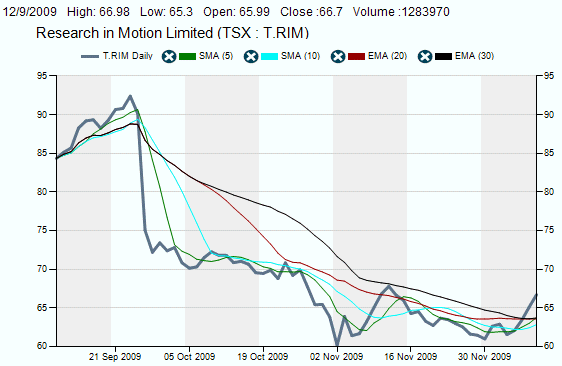
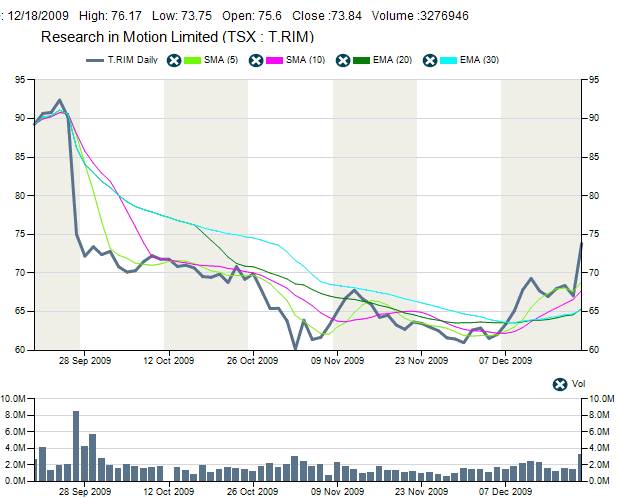
DEC 9 2009:
With the news
that RIM has made a deal to begin selling in Chiba, the
stock has picked up. The 5 day SMA has touched the 20 and 30
day EMA and the 10 day SMA has also turned up. My Dec 60
puts I believe will expire. I have
sold 5 Puts for Jan again at 60.00. which is
just below 80 day support. I am still holding the
Dec 68 calls, Dec 80 Calls and the Jan 76 Calls. I
have placed an order to buy 500 shares at 69.00 if
the stock reaches that level. This will turn my Dec
68 calls into covered calls. The stock has not hit
70.00 since Oct 27.
 |
| Dec 9 09 |
67.03 |
STO 5 Naked Puts Jan 60 @ 1.65 |
2.75 |
|
|
13.25 |
|
|
811.75 |
6671.50 |
172,000.00 |
|
DEC 10 2009:
The 10 day has
now reached the 20 and 30 day EMA. I changed my order from
purchasing at 69 to purchasing at 68. I then bought to close
my Dec 68 calls and rolled to Jan 68 for a net credit of
about 3.80 after commissions. I
then closed my Dec 60 puts and shorted 5 Jan 62 Puts
for an additional 1.75. I will not hold these to
expiry but plan to hold them only while the stock
moves higher or sideways. This is purely an
intrinsic value play.
 |
| Dec 10 09 |
68.00 |
Bought 500 Shares @ 68.00
COMMENTS: THE CAPITAL COMMITTED changed by just 7.00 as the
capital of 34000 was already committed to the DEC 68 calls
when they were sold as naked calls on Nov 2 2009 |
|
500 |
68.01 |
7.00 |
(34007.00) |
(34007.00) |
|
|
172,007.00 |
| Dec 10 09 |
68.20 |
BTC 5 Calls Dec 68 @ 2.95
COMMENTS: Again, the capital committed does not change as
these are now covered calls |
(4.33) |
500 |
68.01 |
13.25 |
|
(34007.00) |
(1488.25) |
5183.25 |
172,007.00 |
| Dec 10 09 |
69.25 |
STO 5 Covered Calls Jan 68 @ 5.05
COMMENTS: Again capital committed does not change as these
are now covered calls |
7.42 |
500 |
68.01 |
13.25 |
|
(34007.00) |
2511.75 |
7695.00 |
172,007.00 |
| Dec 10 09 |
69.25 |
BTC 5 Puts Dec 60 @ .36 |
(.60) |
500 |
68.01 |
13.25 |
|
(34007.00) |
(193.25) |
7501.75 |
142,007.00 |
| Dec 10 09 |
69.30 |
STO 5 Puts Jan 62 @ 1.75 |
2.82 |
500 |
68.01 |
13.25 |
|
(34007.00) |
861.75 |
8363.50 |
173,007.00 |
|
DEC 18 2009: With the earnings news beating
expectations the stock has come back to life. In the opening
minutes of today's trading, the stock jumped 13% allowing me
to close the Jan 60 and 62 Puts. To date we are up a little
over 21% in 6 months on RIM. Today is also expiry for
December. With the jump up in the stock price and the best
volume since September's news of poorer than expected
earnings, I will wait before making my next trade. I need
the stock to pullback a little and then look again at the
January or February puts. The Dec 80 calls will expire
worthless today.
 |
| Dec 18 09 |
75.88 |
BTC 5 Puts Jan 62 @ .25 |
(.40) |
500 |
68.01 |
13.25 |
|
(34007.00) |
(138.25) |
8225.25 |
142,007.00 |
| Dec 18 09 |
75.88 |
BTC 5 Puts Jan 60 @ .17 |
(.28) |
500 |
68.01 |
13.25 |
|
(34007.00) |
(98.25) |
8127.00 |
112,007.00 |
| Dec 18 09 |
73.96 |
Expiry: 5 Naked Calls Dec 80 Expired |
|
500 |
68.01 |
|
|
(34007.00) |
|
|
72,007.00 |
| Dec 22 09 |
71.31 |
STO 5 Puts Feb 60 @ .74 |
1.23 |
500 |
68.01 |
13.25 |
|
(34007.00) |
356.75 |
8483.75 |
102,007.00 |
| Dec 22 09 |
71.31 |
STO 5 Calls Feb 80 @ 1.20 |
1.50 |
500 |
68.01 |
13.25 |
|
(34007.00) |
586.75 |
9070.50 |
142,007.00 |
END OF 2009 -
INCOME - $9070.50 for 7 months While the return would
appeaar to be just 6.3% it is actually considerably higher
as the percentage I show is a simple calculation of taking
the income and dividing it by the amount of capital that is
in use at the year end. Actually the return is higher based
on the amount of capital in use at varying times. So far the
strategy does appear to have merit. Next year should be
quite interesting.
SUMMARY OF STRATEGY: In my opinion the 10-20-30 moving
averages strategy was very successful this year, however I
am not sure it is necessary to take advantage of every
movement to sell more naked option positions. Next year I
will work towards having fewer option trades open at the
same time. |