Javascript DHTML Drop Down Menu Powered by Drop Down Menu
FullyInformed.com - Options and Stock Strategies For Income

 SignUp For Updates

  You are here:


Bookmark and Share


MARKET DIRECTION CALLS
August 2 2011 - Selling Intensifies
August 1 2011 - Bear Returns
July 28 2011 - Before The Open
July 27 2011 - Down But Are We Out?
July 20 2011 - Stock Market Volatility
July 18 2011 - Investors' Nervousness
July 15 2011 - Earnings VS Bleak Data
July 14 2011 - Below 1310
July 13 2011 - Ugly Looking Chart
July 12 2011 - Razor's Edge
July 8 2011 - Nasdaq Leads The Way
July 5 2011 - Expected Weakness
July 1 2011 - Overbought
Jun 28 2011 - July Rally?
Jun 27 2011 - Mixed Signals 
Jun 21 2011 - Bottom Or Bounce?
Jun 16 2011 - Raising Cash
Jun 15 2011 - More Downside To Come?
Jun 14 2011 - Bounce or Bottom?
Jun 12 2011 - Batten Down The Hatches
Jun 6 2011 - Bounce Sometime Soon?
Jun 2 2011 - Sell Signals and Warnings Everywhere
Jun 1 2011 - How Bad Could The Selling Get
Jun 1 2011 - Tread Carefully - Markets Remains Overvalued
May 31 2011 - Success - 100 Day Moving Average Tested
May 17 2011 - Be Careful Out There
Apri 18 2011 - Two Bears Compared
Apr 13 2011 - Why I Bought Puts Today
Apr 4 2011 - Breaking The February Highs
Mar 16 2011 - The Art Of Being Wrong
Mar 15 2011 - Market Remains Resilient
Mar 11 2011 - Trend Is Down
Feb 25 2011 - Trend Turning Bearish
Feb 11 2011 - Still Up - But Watch For June
Jan 3 2011 - Trend Remains Positive
  MARKET DIRECTION CALL
S&P 500
March 16 2011 - The Art Of Being Wrong
My outlook for today was way off mark. Talk about being blindsided! So now where is the market heading? Looking at the chart it would appear the market is heading lower before it can move up. Technically a lower close today than yesterday's open means we have more downside ahead of us.

 Here is a longer term view of the market. Today the S&P touched the 100 day EMA. A simple technical method that has been used for years on the market is using the 20 day, 50 day and 200 day EMA. When the 20 day EMA crosses the 50 day EMA the short term trend is down. When the 50 day EMA crosses the 200 day EMA the longer term trend is down and vice versa for market up calls.


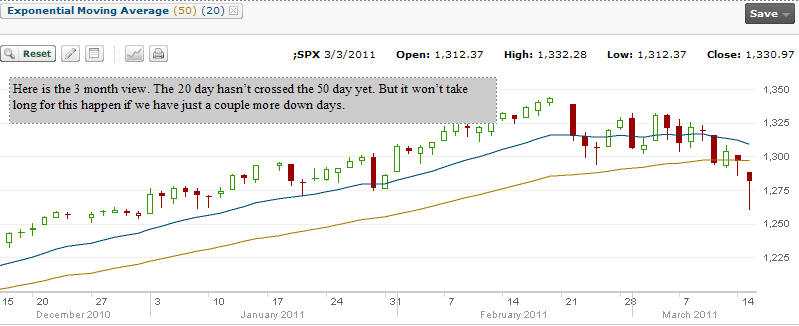
Below is a 3 month look. The 20 Day has not crossed the 50 day EMA but just a couple more down days could give that short term down trend signal. Does the signal actually work? Surprisingly it is pretty accurate, but this simple method cannot pick the top or bottom of a market, as often, the trend has to become set before the EMA can indicate a clear direction. The short term signals are a little more inaccurate as sometimes in a choppy market like last summer (2010) the signal was given twice of market down and twice of market up. So being whipsawed definitely happens.  

The problem the market faces now is the Japanese disaster, Middle East uprisings and the high price of oil. These three have finally proved the market's undoing (notice how often things happen in three's and I'm not superstitious) The question now is, if any of these gets taken out of the picture, will the market resume its climb? Short term though, I believe the market remains in a downtrend. How low is tough to say, but the 200 day which is around the 1210 to 1220 level on the S&P could be the first spot to keep an eye on. Right now I am reducing the number of put contracts being sold in order to keep some of my capital available for opportunities as they present themselves.


Disclaimer: There are considerable risks involved in all investment strategies. Trade at your own risk.
Stocks, options and investing are risky and can result in considerable losses. None of the strategies, stocks or information discussed or presented are financial advice, trading advice or recommendations. Fullyinformed.com is a private website. Everything presented and discussed are the author's ideas and opinions only.
By using this site, you agree to be bound by its terms of use. The full terms of use can be read here. If you do not agree to the terms of use, do not use this site. The author of fullyinformed.com assumes no liability for topics and ideas discussed, errors and omissions, ads and their content and external links. Any corporate insignia used are registered trademarks of their respective company or corporation and are being used for identification purposes only. All material copyrighted by FullyInformed.com. Reproduction in whole or in part prohibited. Copyright © 2008

 |  site map  |  privacy policy  |  contact me  |  subscribe  |  exchange links  |  the author of fullyinformed  |