I set up a Yahoo forum for those interested in discussing selling stock
options for income including covered
calls, selling naked puts, spreads and other option and stock strategies.
JOIN HERE
Apr 29
2011 / Microsoft Stock Symbol - MSFT
Microsoft Third Quarter Earnings
To better understand how I will
pick my strike points and how I will look at the future for
Microsoft stock, let's look at this Microsoft stock
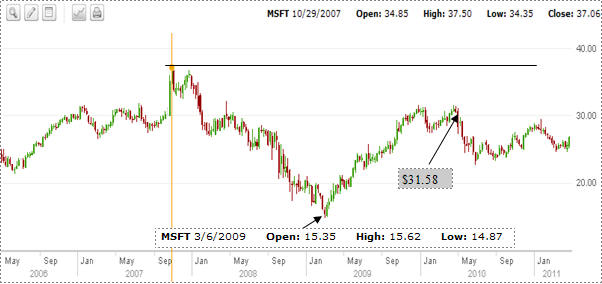
history chart (below) for the past 5 years. Like so many stocks, Microsoft
stock made new all
time highs in the fall and winter of 2007 at one point
reaching $37.50. Then like all the stocks, it was hammered
in the bear market falling to a low on March 6 2009 of
$14.87 a loss of $22.63 or 60%. Quite a fall indeed. Since
then Microsoft stock climbed back reaching a high of $31.58 on
April 23 2010. Since then the Microsoft stock value has failed to recover
those highs. So what does this chart tell us? Well for one
thing, not to buy Microsoft stock above $26.50 until the
Microsoft stock value rises and sets a new higher range,
possibly 28 to 30 or even 30 to 32. Looking at the chart
below and being aware of the earnings chart from Part 1, I
know that even better earnings is going to have a hard time
driving this stock higher. However I also know that a
continuation of good earnings should keep the stock from
falling much below support. (More about support in Microsoft
stock below)
To perhaps better understand
what an investor might expect in the future, it is good to
again return to the Microsoft Stock History chart and look
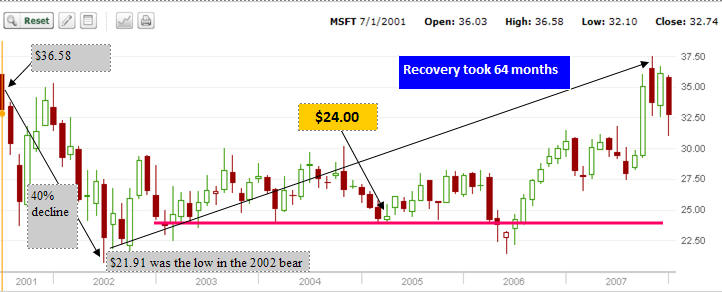
back at how the stock performed in the previous bear market. I have left
out of the chart below the run up in 2000 when the dot com
frenzy was underway. Instead this history chart gives a much more
realistic picture of Microsoft. The bear market chopped 40%
off the value of Microsoft stock in the 2001 to 2002 bear
market. Again looking at the stock history, It took 64 months for the stock
to recover to its previous high and then the next bear
market commenced in 2007.
You can understand the value of reviewing
Microsoft stock price history chart. The chart shows a very
strong support line at the value around $24. I have marked
it in pink. This support line goes back for years and
Microsoft stock repeatedly tested
this support throughout the 64 months before finally making a new uptrend
in 2006. I believe this $24.00 valuation marks pretty
solid support for Microsoft. This immediately tells me that
Microsoft stock options at $24 should be studied for selling
puts and for those who are call buyers, to buy calls. But of
particular interest is the length of time to recovery.
Therefore in the last bear market Microsoft
Stock took almost 5 and a half years to recover the previous high.
Below is the past 5 years Microsoft stock price history
chart again. Remembering that it took 5 and a half years
from the last bear market bottom for the stock to recover,
this could mean that Microsoft's stock has only been two
years into the recovery. Based on this simple strategy, I
know there is no need to chase this stock. I also know that
should some sold puts get caught in the money such as some
of the puts I am presently holding at the $27 strike level,
I will have lots of time to work these short puts lower and
eventually out of the money or take assignment on a much
smaller number of contracts than 6 put contracts I am still
holding.
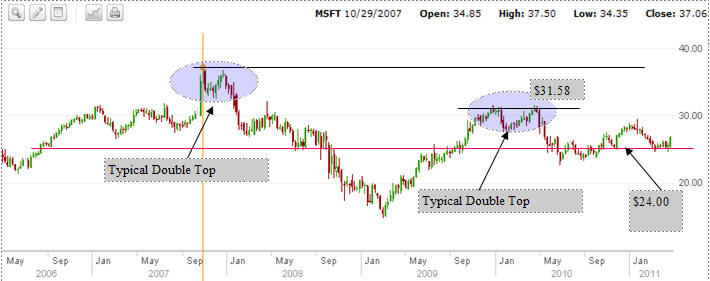
You can see the typical
double top of Microsoft in 2007 and again in 2010. I have
drawn in the support line at $24.00. Looking at this chart I
can see that Microsoft stock market support remains stuck at $24.00.
Look at how it has been tested again since it pulled back
from $31.58 in Jan 2010. Whenever the
stock runs away from support, it inevitably falls back to
it, even if it is months later. This is valuable information for
me to have as I know what Microsoft stock options to
seriously look at, but it also reminds me that I
can consider selling longer term puts at the $25, $24 strikes or
even lower such as I have done at this time through my
current
reverse naked puts ladder strategy in place on Microsoft
stock.
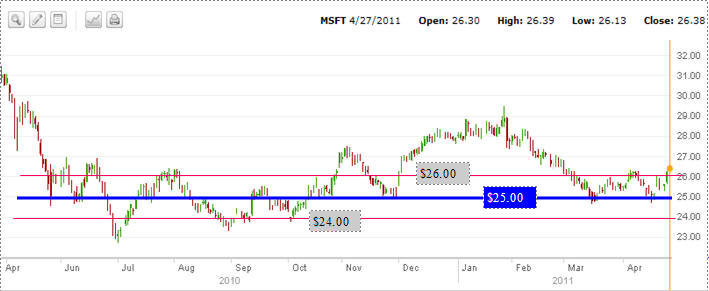
The final chart shows the price of Microsoft
stock for the last 12 months. Looking at the chart and
taking Microsoft earnings history into account, Microsoft may have a
chance to recover to the $28 level from back in Jan of this
year, but Microsoft would need a completely different
direction for investors to get excited about it again. This
is a staid, boring stock. Microsoft's dividend has increased annually for
many years. You can tell from all my charts that this stock
has really gone nowhere in more than 10 years. Microsoft
stock has
remained for the most part in a range between $24 on the low
and $26 on the high. This makes the Microsoft stock option put strike to sell
$25.00. Even if the stock falls below $25.00, I have great
confidence that until the support is broken at $24, the
stock should recover and place the Microsoft puts I have
sold out of money and allow them to expire. The charts also
tell me that I can sell the $25 strike on every dip.
SUMMARY
This is the type of study I do for every
stock before deciding whether to risk my hard earned
capital. Doing this type of Microsoft stock analysis and
keeping these charts up to date, provide me with valuable
history which I can use for future decisions. Basically the
past helps me in the present and in the future.
Microsoft has been an easy stock to sell puts against and I for
one am delighted with the go nowhere attitude of the stock.
I do not see this stock breaking from its range. Looking
back through history, even better earnings has not been able
to change the range on this stock. I have been
selling puts on Microsoft for years and earned double
digits returns every year. I have enjoyed Microsoft so much
that I wrote an article entitled
Microsoft - better than gold. I am sure there are lots
of other investors using other strategies to benefit from
Microsoft's range, but my strategy remains with selling
puts.
Return To Part 1