
 Tuesday Aug 15 2017 saw stocks mixed with stocks moving lower, dominating those moving higher. Two big name stocks that hurt the markets were Lowers (LOW) and Home Depot (HD) which both fell by large percentages weakening the index. Meanwhile the US dollar rose to its highest level in 3 weeks. Oil prices were flat following Monday’s big drop. Gold prices fell back to close at $1279.70 with a reduction in tensions with North Korea.
S&P Index Close
The S&P index ended down 1.23 to 2464.61.
Dow Jones Index Close
The Dow Jones ended up 5.28 to 21,998.99.
NASDAQ Index Close
The NASDAQ closed down 7.22 to 6,444.01.
Stock Market Outlook

Stock Market Outlook review of Aug 15 2017
Chart Comments At The Close:
The S&P moved sideways on Tuesday and closed below the 21 day moving average or Middle Bollinger Band. The close left behind a bearish candlestick for Wednesday.
All the major indexes are climbing higher. The Bollinger Bands Squeeze had appeared to be not forming but with the markets not moving higher there are signs again that a Bollinger Bands Squeeze is starting.
Stock Market Outlook: Technical Indicators:
Momentum: For momentum I use a 10 period when studying market direction. Momentum is negative and moving lower.
MACD Histogram: For MACD Histogram, I am using the Fast Points set at 13, Slow Points at 26 and Smoothing at 9. MACD (Moving Averages Convergence / Divergence) issued a sell signal on Aug 3. The sell signal is still strong but you can see that the MACD histogram is starting to weaken.
Ultimate Oscillator: The Ultimate Oscillator settings are: Period 1 is 5, Period 2 is 10, Period 3 is 15, Factor 1 is 4, Factor 2 is 2 and Factor 3 is 1. These are not the default settings but are the settings I use with the S&P 500 chart set for 1 to 3 months. The Ultimate Oscillator is back negative and moving sideways. almost unchanged from Monday.
Slow Stochastic: For the Slow Stochastic I use the K period of 14 and D period of 3. The Slow Stochastic tries to predict the market direction further out than just one day. The Slow Stochastic has a buy signal in place for Wednesday.
Relative Strength Index: The relative strength index is set for a period of 5 which gives it 5 days of market movement to monitor. It often is the first indicator to show an overbought or oversold signal. The RSI signal is unchanged from Monday.
Rate of Change: Rate Of Change is set for a 21 period. This indicator looks back 21 days and compares price action from the past to the present. The rate of change signal is positive but unchanged from Monday.
Support Levels To Be Aware Of:
The market has developed light support at 2450 and good support at 2425. There is also light support at 2400, 2380, 2350 and 2300.
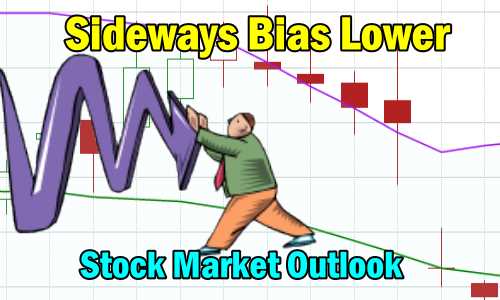
Stock Market Outlook for Tomorrow – Wednesday Aug 16 2017
For Wednesday Aug 16 2017 the technical indicators have a few changes worth noting. The big one is a buy signal from the Slow Stochastic. A second one is the weaker MACD histogram. Finally, the third is the number of indicators that were unchanged on Tuesday from Monday’s close. We could be setting up for a sideways day on Wednesday with little change. There was enough weakness on Tuesday though to place the outlook at sideways with a bias lower, but overall we could just as easily see a move up and above the 21 day moving average by the close of trading on Wednesday.
Stay FullyInformed With Email Updates
Market Direction Internal Links
Profiting From Understanding Market Direction (Articles Index)
Understanding Short-Term Signals
Market Direction Portfolio Trades (Members)
Market Direction External Links
IWM ETF Russell 2000 Fund Info
Market Direction SPY ETF 500 Fund Info