
Tuesday after the long Presidents Day Holiday saw stocks under a bit of selling pressure.
The S&P ended the day with just a slight loss of 2.24 points but it made another new intraday high during the morning, reaching 3950.
Stock Market Outlook Chart Comments At The Close on Tue Feb 16 2021
The S&P closed relatively flat on Tuesday at 3932 down just a couple of points. The closing candlestick though is bearish for Wednesday. Normally a candlestick such as this indicates a bit of indecision so we should see further weakness on Wednesday but with a bullish bias.
The Upper Bollinger Band is continuing to rise while the Lower Bollinger Band is falling lower. Both of these trends are bullish for higher prices. If we see the Lower Bollinger Band begin to turn back up, that is a cautionary signal to watch for dips to appear. For now, the Lower Bollinger Band is falling away from the 50 day.
The 21 day moving average is rising and is now at 3850. The 200, 100 and 50 day moving averages are still climbing with the 100 day moving average now at the 3650 valuation and the important 200 day moving average at 3470. These are strong indicators the market will continue to push to new highs.

Stock Market Outlook review of Tue Feb 16 2021
Stock Market Outlook: Technical Indicators Review:
Momentum: Momentum is falling and is positive.
- Settings: For momentum I use a 10 period when studying market direction.
MACD Histogram: MACD (Moving Averages Convergence / Divergence) issued an up signal on Fri Feb 5 2021. On Tuesday the up signal continued to show strength.
- Settings: For MACD Histogram, I am using the Fast Points set at 13, Slow Points at 26 and Smoothing at 9.
Ultimate Oscillator: The Ultimate Oscillator is falling away from overbought readings.
- Settings: The Ultimate Oscillator settings are: Period 1 is 5, Period 2 is 10, Period 3 is 15, Factor 1 is 4, Factor 2 is 2 and Factor 3 is 1. These are not the default settings but are the settings I use with the S&P 500 chart set for 1 to 3 months.
Slow Stochastic: The Slow Stochastic has a weak up signal for Wednesday and is still very overbought.
Settings: For the Slow Stochastic I use the K period of 14 and D period of 3. The Slow Stochastic tries to predict the market direction further out than just one day.
Relative Strength Index: The RSI signal is moving sideways.
- Settings: The relative strength index is set for a period of 5 which gives it 5 days of market movement to monitor. It is often the first indicator to show an overbought or oversold signal.
Rate of Change: The rate of change signal is rising.
- Settings: Rate Of Change is set for a 21 period. This indicator looks back 21 days and compares price action from the past to the present. With the Rate Of Change, prices are rising when signals are positive. Conversely, prices are falling when signals are negative. As an advance rises the Rate Of Change signal should also rise higher, otherwise the rally is suspect. A decline should see the Rate Of Change fall into negative signals. The more negative the signals the stronger the decline.
Support and Resistance Levels To Be Aware Of:
4000 is resistance
3900 is resistance
3850 is support. The 21 day moving average is presenting here.
3800 is support.
3750 is support
3700 is light support
3600 is strong support
3550 is support
3500 is strong support
3450 is support. The 200 day moving average is just above this valuation. A drop this low would represent an 11% correction.
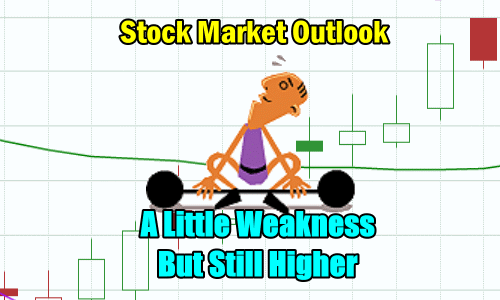
Stock Market Outlook for Tomorrow – Wed Feb 17 2021
For Wednesday there is still weakness in the technical indicators for the start of the day. However this is more profit-taking and adjusting of positions, rather than heavy selling.
Wednesday should see weakness but the close should still be higher.
Stock Market Outlook Archives
Stock Market Outlook for Thu Apr 18 2024 – Deeply Oversold – Bounce Attempt Expected

Morning Investing Strategy Notes for Wed Apr 17 2024

Stock Market Outlook for Wed Apr 17 2024 – Another Bounce Attempt

Morning Investing Strategy Notes for Tue Apr 16 2024
Stock Market Outlook for Tue Apr 16 2024 – Deeply Oversold
Morning Investing Strategy Notes for Mon Apr 15 2024
Stock Market Outlook for Mon Apr 15 2024 – Expect A Bounce

Morning Investing Strategy Notes for Fri Apr 12 2024
Stock Market Outlook for Fri Apr 12 2024 – All About Bank Earnings

Morning Investing Strategy Notes for Thu Apr 11 2024
Stock Market Outlook for Thu Apr 11 2024 – Weakness and Lower

Morning Investing Strategy Notes for Wed Apr 10 2024
Stock Market Outlook for Wed Apr 10 2024 – All About The CPI Numbers

Morning Investing Strategy Notes for Tue Apr 9 2024
Stock Market Outlook for Tue Apr 9 2024 – Morning Weakness Possible But Higher Close
