
Prior Trading Day Summary
On Tuesday stocks opened lower but then spent the day rallying higher, ending the day positive.
The SPX rose off a deep morning low to close up 5 points to 6616. Down volume still dominated at 59% of all volume being traded.
The NASDAQ saw volume jump to 11.4 billion. 68% of al volume was being traded to the upside by the close although 52% of all stocks were falling. The index closed up 21 points to close at 22017.
With news after the close that President Trump ordered a 2 week ceasefire to work out a peace deal with Iran, Wednesday already looks higher.
Lets review the SPX closing technical indicators from Tue Apr 7 2026 to see what we should expect for Wed Apr 8 2026.
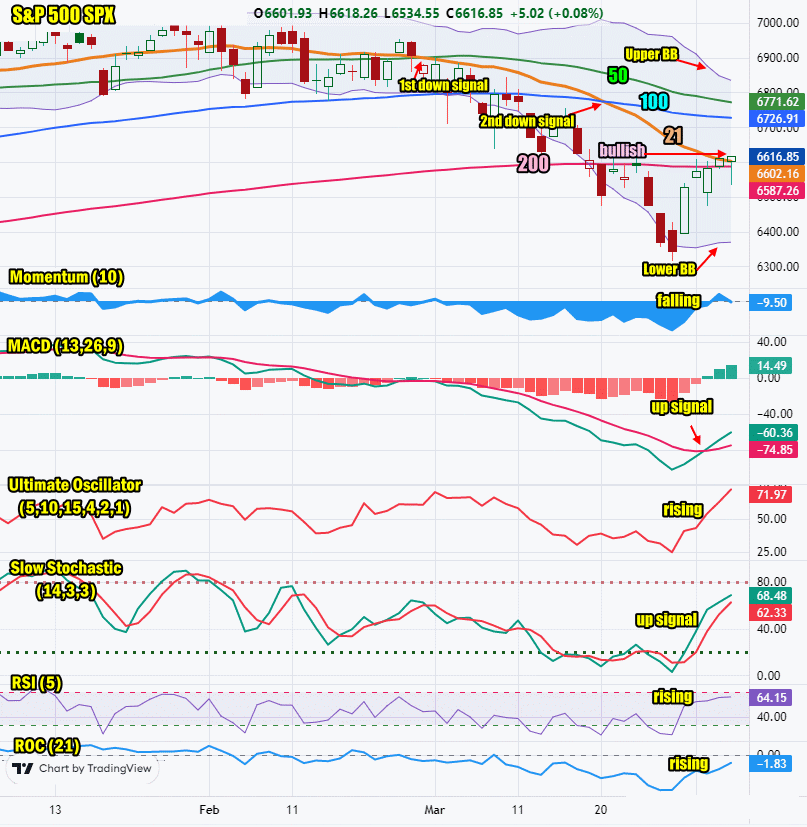
Stock Market Outlook: SPX Closing Chart For Tue Apr 7 2026
The index closed below the 50 and 100 day moving average but above the 21 and 200 period moving average. This is bullish.
The closing candlestick is bearish for Wednesday. A long shadow was left on the closing candlestick. This shadow normally predicts a spike higher for the index on Wed Apr 8 2026.
The 21 day moving average is falling and closed at 6602.
The 50 day moving average is falling and closed at 6771. This is bearish.
The 100 day moving average is falling and closed at 6726. This is bearish.
The 200 day moving average is falling and closed at 6587. This is bearish.
The Lower Bollinger Band is rising which is bullish. The Upper Bollinger Band is falling which is bearish. While it is too early to predict, a Bollinger Bands Squeeze may be setting up for later in the week.
The SPX chart is bearish but there are also signals advising strength ahead of the index.
SPX Stock Market Outlook review of Tue Apr 7 2026
Stock Market Outlook: Technical Indicators Review
Momentum: Momentum is falling and negative. This is bearish.
|
MACD Histogram: MACD (Moving Averages Convergence / Divergence) issued an up signal on Fri Apr 7 2026. On Tue Apr 7 2026 the up signal gained more strength.
|
Ultimate Oscillator: The Ultimate Oscillator is rising which is bullish. It is nearing overbought.
|
Slow Stochastic: The Slow Stochastic has an up signal which is bullish.
|
Relative Strength Index: The RSI signal is rising which is bullish.
|
| Rate of Change: The rate of change is rising signaling today will end higher. Settings: Rate Of Change is set for a 21 period. This indicator looks back 21 days and compares price action from the past to the present. With the Rate Of Change, prices are rising when signals are positive. Conversely, prices are falling when signals are negative. As an advance rises, the Rate Of Change signal should also rise higher, otherwise the rally is suspect. A decline should see the Rate Of Change fall into negative signals. The more negative the signals the stronger the decline. |
Stock Market Outlook: Support and Resistance Levels |
| 6700 is resistance |
| 6675 is resistance |
| 6650 is resistance |
| 6625 is resistance |
| 6600 is resistance |
| 6585 is resistance |
| 6550 is resistance |
| 6500 is resistance |
| 6475 is resistance |
| 6450 is support |
| 6400 is support |
| 6375 is support |
| 6350 is support |
| 6300 is support |
Stock Market Outlook for Wed Apr 8 2026
The technical indicators are signaling that Wednesday will end higher.
News of a 2 week ceasefire sent stock futures soaring. The market should open higher and try to build on the rally. Oil prices are expected to tumble on the news of the ceasefire.
Wednesday will end higher although possibly not as high as the open for the day.
Potential Economic and Political Market Moving Events
Monday:
10:00 ISM services for March came in lower than estimated at 54.0%
Tuesday:
8:30 Durable goods orders for Feb were lower than estimates at -1.4%
3:00 Consumer credit for Feb rose as estimated at $10 billion.
Wednesday:
2:00 FOMC minutes are released