

Monday saw all 3 indexes climb from their bear market lows in a strong rally on good volume. The S&P rose 92 points to close at 3678. The NASDAQ rose 240 points to close at 10,815.
The bounce came from a deeply oversold market which has tried to bounce several times in the prior week. Monday saw only light selling throughout the day. The S&P saw 90% of all volume moving to the upside. The NASDAQ was not as strong with 65% of all volume being traded to the upside. Overall though, the technical indicators are turning more bullish as of the close on Monday. Let’s review Monday’s close to see the outlook for Tuesday.
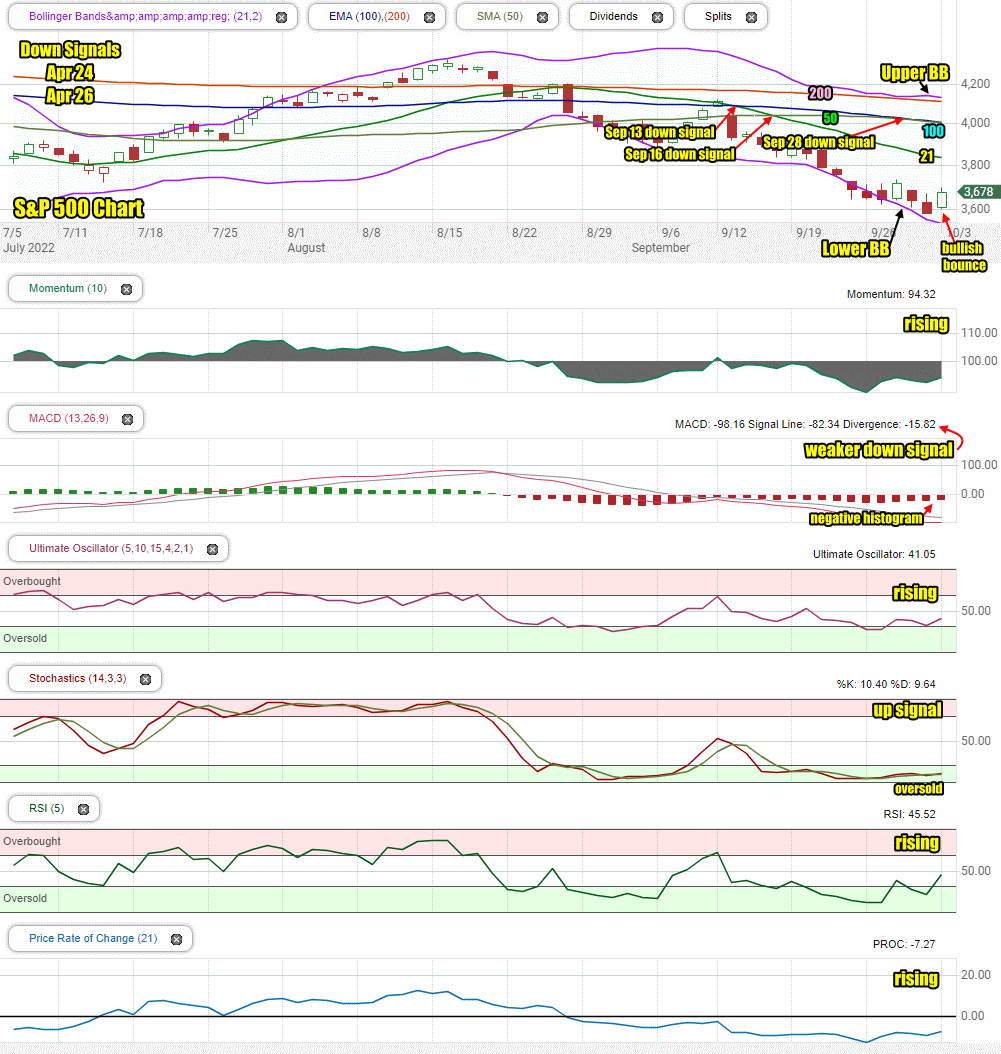
Stock Market Outlook Chart Comments At The Close on Mon Oct 3 2022
At the close of trading the S&P closing candlestick is bullish and points to the bounce continuing. The closing candlestick is further inside the Lower Bollinger Band and above the 3600 valuation. This is bullish.
The 21 day moving average continued its descent and the 100 day continued moving lower below the 50 day. Both are bearish signals.
The Upper Bollinger Band is dipping back but still has not fallen below the 200 day moving average. This is bullish and suggests the index should move higher on Tuesday. The Lower Bollinger Band is still falling sharply but starting to turn sideways. This is bearish but won’t take much to turn the Lower Bollinger Band higher.
All the moving averages are still falling which is bearish.
There are now 5 down signals in place since April and no up signals.
The chart is 80% bearish for Tuesday with the Upper Bollinger Band, Lower Bollinger Band and closing candlestick indicating the index will move higher on Tuesday.
Stock Market Outlook review of Mon Oct 3 2022
Stock Market Outlook: Technical Indicators Review:
Momentum: Momentum is rising and negative.
- Settings: For momentum I use a 10 period when studying market direction.
MACD Histogram: MACD (Moving Averages Convergence / Divergence) issued a down signal on Monday Aug 22. On Monday the down signal lost strength. The histogram also lost strength. Both signals are still bearish but they also indicate the selling pressure is diminishing.
- Settings: For MACD Histogram, I am using the Fast Points set at 13, Slow Points at 26 and Smoothing at 9.
Ultimate Oscillator: The Ultimate Oscillator is rising and still negative.
- Settings: The Ultimate Oscillator settings are: Period 1 is 5, Period 2 is 10, Period 3 is 15, Factor 1 is 4, Factor 2 is 2 and Factor 3 is 1. These are not the default settings but are the settings I use with the S&P 500 chart set for 1 to 3 months.
Slow Stochastic: The Slow Stochastic has an up signal in place. Signals are still at readings we saw in mid-June before the market bounced. The indicator is signaling oversold.
Settings: For the Slow Stochastic I use the K period of 14 and D period of 3. The Slow Stochastic tries to predict the market direction further out than just one day.
Relative Strength Index: The RSI signal is rising sharply.
- Settings: The relative strength index is set for a period of 5 which gives it 5 days of market movement to monitor. It is often the first indicator to show an overbought or oversold signal.
Rate of Change: The rate of change signal is rising.
- Settings: Rate Of Change is set for a 21 period. This indicator looks back 21 days and compares price action from the past to the present. With the Rate Of Change, prices are rising when signals are positive. Conversely, prices are falling when signals are negative. As an advance rises the Rate Of Change signal should also rise higher, otherwise the rally is suspect. A decline should see the Rate Of Change fall into negative signals. The more negative the signals the stronger the decline.
Support and Resistance Levels To Be Aware Of:
3800 is light resistance
3775 is light resistance
3750 is light resistance
3730 is light resistance
3700 is good support
3675 is light support
3650 is light support
3625 is light support
3600 is good support and is a decline of 25%
3585 is light support
3550 is good support
3530 is light support
3515 is light support
3500 is good support and is a decline of 27%
Stock Market Outlook for Tomorrow – Tue Oct 4 2022
For Tuesday the technical indicators have shifted as of Monday’s close. While still negative, all have changed direction and all are pointing to the index as climbing higher on Tuesday.
Markets are still oversold, leaving plenty of strength for the bounce to continue. Watch for dips Tuesday probably in the morning but in general the day will be bullish and a higher close is expected.
Potential Market Moving Events
The biggest market moving event for the week is Friday’s September non-farm payrolls.
Monday:
9:45 US manufacturing PMI came in at 52, higher than expected.
10:00 Construction spending was -0.7%, lower than forecasts of -0.2%.
Tuesday:
10:00 Job openings and quits
10:00 Factory orders
10:00 Core capital goods orders revision
Stock Market Outlook Archives
Stock Market Outlook for Fri Apr 19 2024 – Deeply Oversold – Bounce Likely – Higher Close

Morning Investing Strategy Notes for Thu Apr 18 2024

Stock Market Outlook for Thu Apr 18 2024 – Deeply Oversold – Bounce Attempt Expected

Morning Investing Strategy Notes for Wed Apr 17 2024
Stock Market Outlook for Wed Apr 17 2024 – Another Bounce Attempt

Morning Investing Strategy Notes for Tue Apr 16 2024
Stock Market Outlook for Tue Apr 16 2024 – Deeply Oversold
Morning Investing Strategy Notes for Mon Apr 15 2024
Stock Market Outlook for Mon Apr 15 2024 – Expect A Bounce

Morning Investing Strategy Notes for Fri Apr 12 2024
Stock Market Outlook for Fri Apr 12 2024 – All About Bank Earnings

Morning Investing Strategy Notes for Thu Apr 11 2024
Stock Market Outlook for Thu Apr 11 2024 – Weakness and Lower

Morning Investing Strategy Notes for Wed Apr 10 2024
Stock Market Outlook for Wed Apr 10 2024 – All About The CPI Numbers
