
Monday saw the biggest drop in the S&P since May 12 when the index lost 89 points. On July 19 the loss of 68 points left the index at 4258 and just above the 50 day moving average. There are a number of changes in the technical indicators to review from Monday’s close which will give us some idea what to expect for Tuesday. Let’s take a look.
Stock Market Outlook Chart Comments At The Close on Mon Jul 19 2021
The S&P closed below the 21 day moving average. Intraday the index slipped down to the 50 day but bounced off it. This left behind a bearish candlestick for Tuesday but also a signal that investors should expect a higher probability of a bounce on Tuesday.
The Upper Bollinger Band is turning lower while the Lower Bollinger Band is swinging higher. This may turn into a new Bollinger Bands Squeeze by mid-week. At present this is bearish.
All the major moving averages are still climbing which is bullish but the signals identified above indicate investors should expect a bounce followed by more selling.

Stock Market Outlook review of Mon Jul 19 2021
Stock Market Outlook: Technical Indicators Review:
Momentum: Momentum is falling and negative.
- Settings: For momentum I use a 10 period when studying market direction.
MACD Histogram: MACD (Moving Averages Convergence / Divergence) issued a down signal on Friday July 16. Today the down signal was confirmed by the close.
- Settings: For MACD Histogram, I am using the Fast Points set at 13, Slow Points at 26 and Smoothing at 9.
Ultimate Oscillator: The Ultimate Oscillator is falling and is near oversold readings.
- Settings: The Ultimate Oscillator settings are: Period 1 is 5, Period 2 is 10, Period 3 is 15, Factor 1 is 4, Factor 2 is 2 and Factor 3 is 1. These are not the default settings but are the settings I use with the S&P 500 chart set for 1 to 3 months.
Slow Stochastic: The Slow Stochastic has a strong down signal in place.
Settings: For the Slow Stochastic I use the K period of 14 and D period of 3. The Slow Stochastic tries to predict the market direction further out than just one day.
Relative Strength Index: The RSI signal is falling and is oversold.
- Settings: The relative strength index is set for a period of 5 which gives it 5 days of market movement to monitor. It is often the first indicator to show an overbought or oversold signal.
Rate of Change: The rate of change signal is falling.
- Settings: Rate Of Change is set for a 21 period. This indicator looks back 21 days and compares price action from the past to the present. With the Rate Of Change, prices are rising when signals are positive. Conversely, prices are falling when signals are negative. As an advance rises the Rate Of Change signal should also rise higher, otherwise the rally is suspect. A decline should see the Rate Of Change fall into negative signals. The more negative the signals the stronger the decline.
Support and Resistance Levels To Be Aware Of:
4400 is resistance
4370 is resistance
4350 is resistance
4300 is light support
4290 is light support
4270 is light support
4250 is light support
4225 is light support
4200 is light support
4175 is light support
4150 is light support
4100 is good support
4070 is light support
4050 is light support
4000 is good support
3900 is support
3850 is support
3800 is support
3750 is good support
3700 is light support
3680 is light support
3600 is strong support
Stock Market Outlook for Tomorrow – Tue Jul 20 2021
The drop on Monday is not the start of what will be a large move lower. A lot of the action was a reaction by investors to the possibility of another shutdown or partial shutdown as a new covid-19 variant spreads. As is always the case, early morning selling, resulted in investors joining in the sell-off as the attitude on Monday was “take what profits there are and get out”. That could change quickly back to buying shares again.
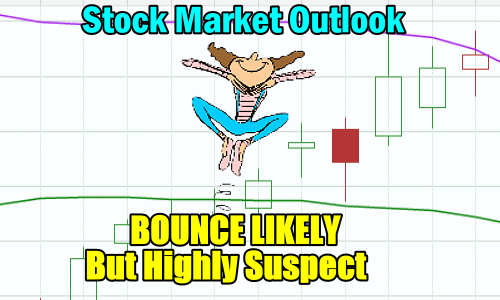
Tuesday should see a bounce despite the strong MACD down signal on Monday by the close. This signal and other technical indicators are advising that the index is deeply oversold and should bounced.. That bounce though, is suspect until there are clear signals that Monday marked a one day event. On Tuesday the expected bounce will be highly suspect as the technical indicators are all pointing to further down days this week for stocks. Therefore Tuesday should bounce and while there is a good chance the index will close higher, there is still room for the SPX to end the day lower.
Stock Market Outlook Archives
Stock Market Outlook for Tue Apr 23 2024 – Bounce But Lower

Morning Investing Strategy Notes for Mon Apr 22 2024

Stock Market Outlook for Mon Apr 22 2024 – No Change – Deeply Oversold Bounce Possible

Morning Investing Strategy Notes for Fri Apr 19 2024
Stock Market Outlook for Fri Apr 19 2024 – Deeply Oversold – Bounce Likely – Higher Close

Morning Investing Strategy Notes for Thu Apr 18 2024
Stock Market Outlook for Thu Apr 18 2024 – Deeply Oversold – Bounce Attempt Expected
Morning Investing Strategy Notes for Wed Apr 17 2024
Stock Market Outlook for Wed Apr 17 2024 – Another Bounce Attempt

Morning Investing Strategy Notes for Tue Apr 16 2024
Stock Market Outlook for Tue Apr 16 2024 – Deeply Oversold
Morning Investing Strategy Notes for Mon Apr 15 2024
Stock Market Outlook for Mon Apr 15 2024 – Expect A Bounce

Morning Investing Strategy Notes for Fri Apr 12 2024
Stock Market Outlook for Fri Apr 12 2024 – All About Bank Earnings
