

On Wednesday the outlook was for a bounce off the 50 day moving average and then on Thursday or Friday a move back lower. However as you will see from the technical indicators below, at present, the rally on Wednesday was strong enough to probably push the index still higher on Thursday. On Wednesday the index rose 37.65 points to 4480.70 which places it back above the important 4475 level.
Let’s review the closing technical signals to see what they advise investors should expected for Thu Sep 16 2021.
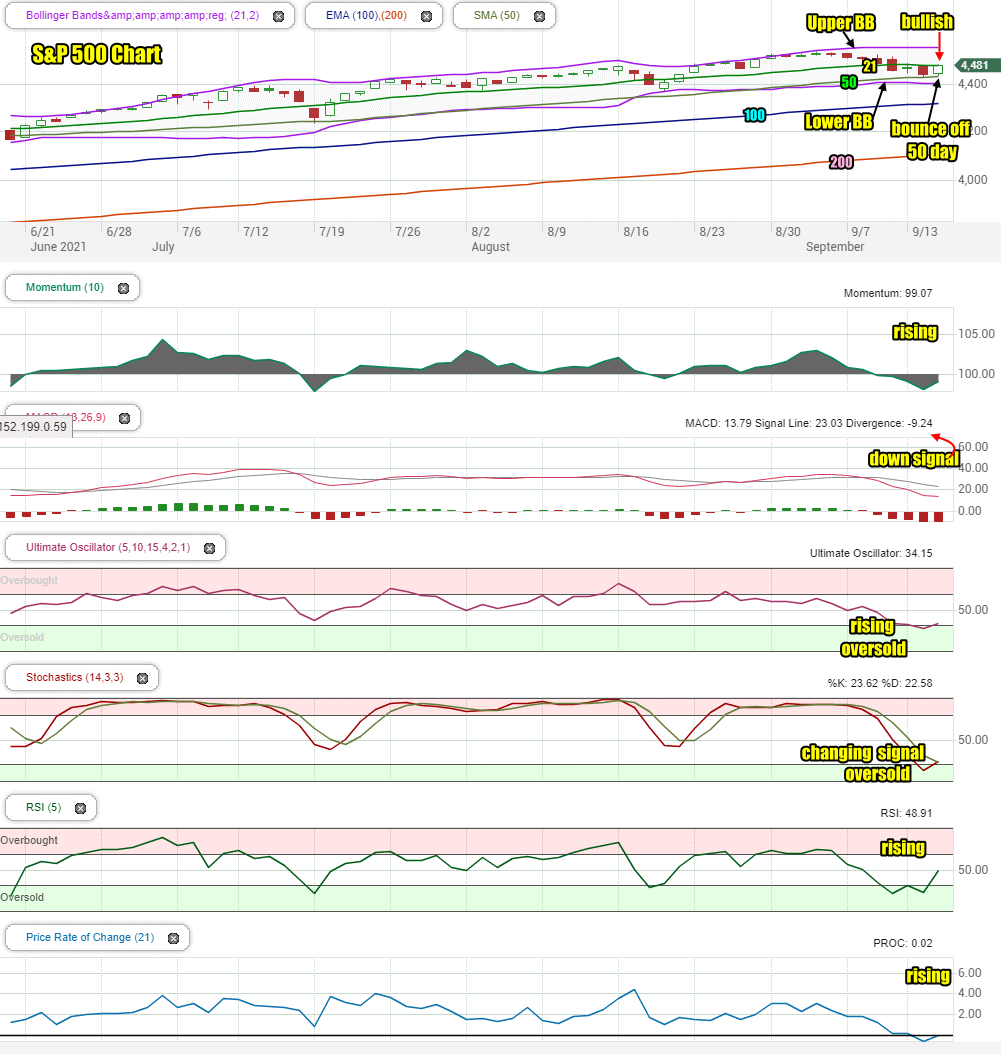
Stock Market Outlook Chart Comments At The Close on Wed Sep 15 2021
The Lower Bollinger Band is back falling lower which is bullish. The Upper Bollinger Band is falling which is bearish.
The 21 and 50 day moving averages are also dipping lower which is bearish.
The closing candlestick on Wednesday is bullish for Thursday. You can see in the chart the index bounced off the 50 day moving average as it has repeatedly done over the past year. It closed at the 21 day.
Only the 100 and 200 day moving averages are climbing. For Thursday there are more bullish signals but there are also still bearish ones to remain aware of.
Stock Market Outlook review of Wed Sep 15 2021
Stock Market Outlook: Technical Indicators Review:
Momentum: Momentum is rising and negative.
- Settings: For momentum I use a 10 period when studying market direction.
MACD Histogram: MACD (Moving Averages Convergence / Divergence) issued a down signal on Thu Sep 9. On Wednesday the down signal lost some strength but remains quite strong to the downside.
- Settings: For MACD Histogram, I am using the Fast Points set at 13, Slow Points at 26 and Smoothing at 9.
Ultimate Oscillator: The Ultimate Oscillator is rising out of oversold readings.
- Settings: The Ultimate Oscillator settings are: Period 1 is 5, Period 2 is 10, Period 3 is 15, Factor 1 is 4, Factor 2 is 2 and Factor 3 is 1. These are not the default settings but are the settings I use with the S&P 500 chart set for 1 to 3 months.
Slow Stochastic: The Slow Stochastic has a down signal in still in place but you can see the signal is on the verge of changing to up. The readings are still oversold.
Settings: For the Slow Stochastic I use the K period of 14 and D period of 3. The Slow Stochastic tries to predict the market direction further out than just one day.
Relative Strength Index: The RSI signal is rising and no longer oversold.
- Settings: The relative strength index is set for a period of 5 which gives it 5 days of market movement to monitor. It is often the first indicator to show an overbought or oversold signal.
Rate of Change: The rate of change signal is rising.
- Settings: Rate Of Change is set for a 21 period. This indicator looks back 21 days and compares price action from the past to the present. With the Rate Of Change, prices are rising when signals are positive. Conversely, prices are falling when signals are negative. As an advance rises the Rate Of Change signal should also rise higher, otherwise the rally is suspect. A decline should see the Rate Of Change fall into negative signals. The more negative the signals the stronger the decline.
Support and Resistance Levels To Be Aware Of:
4550 is resistance
4525 is resistance
4500 is resistance
4490 is resistance
4475 is light support
4450 is light support
4400 is good support
4370 is good support
4350 is light support
4300 is light support
4290 is light support
4270 is light support
4250 is good support
4225 is light support
4200 is good support
4175 is light support
4150 is light support
4100 is good support
4070 is light support
4050 is light support
4000 is good support
3900 is support
3850 is support
3800 is support
3750 is good support
3700 is light support
3680 is light support
3600 is strong support
Stock Market Outlook for Tomorrow – Thu Sep 16 2021
For Thursday we will see some dips especially early morning and in the mid-afternoon. However there are still enough oversold signals in the technical analysis to expect a second bounce on Thursday.
Expect a choppy day with dips, but a higher close for September 16.
Stock Market Outlook Archives
Stock Market Outlook for Thu Apr 25 2024 – Weakness and Lower

Morning Investing Strategy Notes for Wed Apr 24 2024

Stock Market Outlook for Wed Apr 24 2024 – Some Weakness But Higher Close

Morning Investing Strategy Notes for Tue Apr 23 2024
Stock Market Outlook for Tue Apr 23 2024 – Bounce But Lower

Morning Investing Strategy Notes for Mon Apr 22 2024
Stock Market Outlook for Mon Apr 22 2024 – No Change – Deeply Oversold Bounce Possible

Morning Investing Strategy Notes for Fri Apr 19 2024
Stock Market Outlook for Fri Apr 19 2024 – Deeply Oversold – Bounce Likely – Higher Close

Morning Investing Strategy Notes for Thu Apr 18 2024
Stock Market Outlook for Thu Apr 18 2024 – Deeply Oversold – Bounce Attempt Expected
Morning Investing Strategy Notes for Wed Apr 17 2024
Stock Market Outlook for Wed Apr 17 2024 – Another Bounce Attempt

Morning Investing Strategy Notes for Tue Apr 16 2024
Stock Market Outlook for Tue Apr 16 2024 – Deeply Oversold