
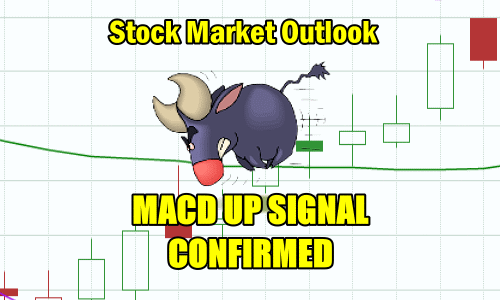
Wednesday saw a up confirmation from the MACD indicator despite the market exhibiting weakness and closing slightly lower.
Stock Market Outlook Chart Comments At The Close on Wed Oct 16 2019
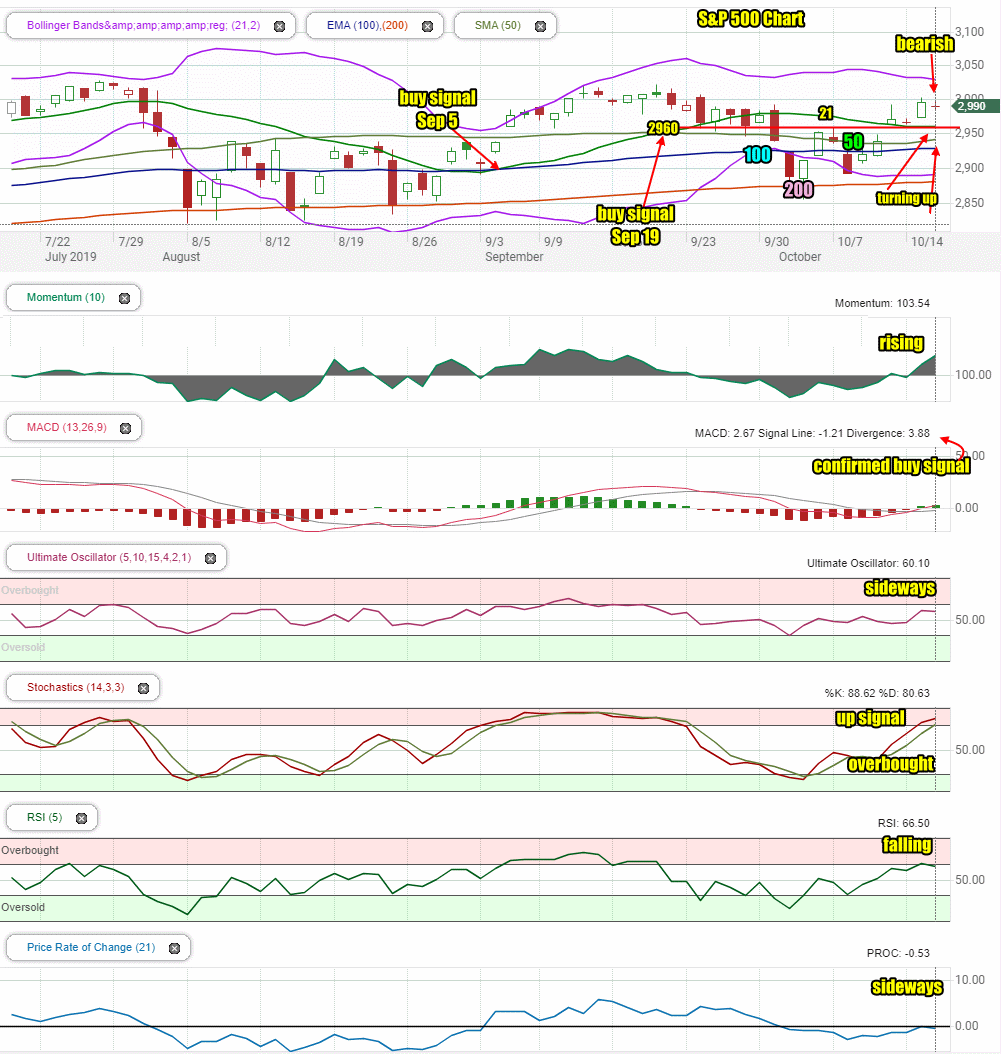
The 21 day and 50 day moving averages are still rising despite the weakness in the markets and the lower close for today.
The inability of the index to retake 3000 left behind a bearish candlestick for Thursday.
You can also see that the Lower Bollinger Band is still turning up adding to the bullish outlook.
The 100 day moving average is starting to turn higher and the 200 day is still climbing.
The two buy signals from September are still in place.
The SPX chart is bullish.
Stock Market Outlook review of Wed Oct 16 2019
Stock Market Outlook: Technical Indicators Review:
Momentum: Momentum is rising and positive.
- Settings: For momentum I use a 10 period when studying market direction.
MACD Histogram: MACD (Moving Averages Convergence / Divergence) issued an up signal on Tue Oct 15 2019. The up signal was confirmed today despite the lower close. This is bullish.
- Settings: For MACD Histogram, I am using the Fast Points set at 13, Slow Points at 26 and Smoothing at 9.
Ultimate Oscillator: The Ultimate Oscillator signal is positive and moving sideways.
- Settings: The Ultimate Oscillator settings are: Period 1 is 5, Period 2 is 10, Period 3 is 15, Factor 1 is 4, Factor 2 is 2 and Factor 3 is 1. These are not the default settings but are the settings I use with the S&P 500 chart set for 1 to 3 months.
Slow Stochastic: The Slow Stochastic has a strong up signal in place is overbought.
- Settings: For the Slow Stochastic I use the K period of 14 and D period of 3. The Slow Stochastic tries to predict the market direction further out than just one day.
Relative Strength Index: The RSI signal is falling.
- Settings: The relative strength index is set for a period of 5 which gives it 5 days of market movement to monitor. It is often the first indicator to show an overbought or oversold signal.
Rate of Change: The rate of change signal is moving sideways.
- Settings: Rate Of Change is set for a 21 period. This indicator looks back 21 days and compares price action from the past to the present. With the Rate Of Change, prices are rising when signals are positive. Conversely, prices are falling when signals are negative. As an advance rises the Rate Of Change signal should also rise higher, otherwise the rally is suspect. A decline should see the Rate Of Change fall into negative signals. The more negative the signals the stronger the decline.
Support and Resistance Levels To Be Aware Of:
3000 is resistance
2960 is light support
2950 was light support
2900 is light support
2860 is light support
2840 is support
2800 is strong support
2795 is light support
2745 to 2750 is light support
2725 is light support
2700 is light support
2675 is light support
2650 is support
2625 is light support
2600 is support.
Stock Market Outlook for Tomorrow – Thu Oct 17 2019
The most important signal on Wednesday was the up signal from MACD being confirmed. This confirmed up signal was made despite the market weakness and the lower close. This is bullish for stocks.
There is a lot of weakness hanging on, but almost all of it is emotional as investors worry about the outcome of a trade deal with China.
The technical indicators are predominantly positive and continue to signal that the index will move higher.
Thursday should see the SPX move up although dips are likely and I will be trading in any market dips. Even if stocks falter on Thursday, the confirmed up signal from MACD shows the underlying strength in the market is still higher.
Stock Market Outlook Archives
Stock Market Outlook for Thu Apr 18 2024 – Deeply Oversold – Bounce Attempt Expected

Morning Investing Strategy Notes for Wed Apr 17 2024

Stock Market Outlook for Wed Apr 17 2024 – Another Bounce Attempt

Morning Investing Strategy Notes for Tue Apr 16 2024
Stock Market Outlook for Tue Apr 16 2024 – Deeply Oversold
Morning Investing Strategy Notes for Mon Apr 15 2024
Stock Market Outlook for Mon Apr 15 2024 – Expect A Bounce

Morning Investing Strategy Notes for Fri Apr 12 2024
Stock Market Outlook for Fri Apr 12 2024 – All About Bank Earnings

Morning Investing Strategy Notes for Thu Apr 11 2024
Stock Market Outlook for Thu Apr 11 2024 – Weakness and Lower

Morning Investing Strategy Notes for Wed Apr 10 2024
Stock Market Outlook for Wed Apr 10 2024 – All About The CPI Numbers

Morning Investing Strategy Notes for Tue Apr 9 2024
Stock Market Outlook for Tue Apr 9 2024 – Morning Weakness Possible But Higher Close
