
Summary:
The decline of International Business Machines Stock hurt the market on Wednesday. It was the worst one day drop in three years. However IBM’s decline was not the only factor weighing on stocks on Wednesday. Fed minutes showed a hawkish attitude where it had one time been accommodative. Bond yields, particularly short-term, which had been falling, turned around and moved higher. The end sawindexes close well off their highs and the Dow closed negative.
Closing Statistics from Wed Apr 18 2018
The S&P rose 2.25 points to 2708.64 gaining 0.08%
The NASDAQ Composite rose 14.14 points to 7295.24 gaining 0.19%
The Dow Jones Industrial Average fell 38.56 points to 24,748.07 losing 0.16%
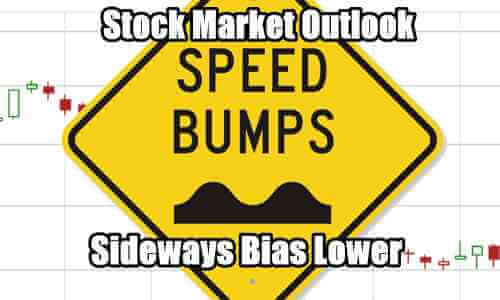
Stock Market Outlook Chart Comments At The Close on Wed Apr 18 2018
The chart was mixed after the close. The index closed above the 50 day once again but the closing candlestick indicated selling will send the index lower on Thursday.
While the 21, 50 and 100 day moving averages are still falling, the 200 day is rising. It won’t take much for the other moving averages to start to rise as well.
The Bollinger Bands Squeeze is continuing to develop and it now looks like it will probably send stocks lower.

Stock Market Outlook review of Wed Apr 18 2018
Stock Market Outlook: Technical Indicators Review:
Momentum: For momentum I use a 10 period when studying market direction. Momentum is positive and falling.
MACD Histogram: For MACD Histogram, I am using the Fast Points set at 13, Slow Points at 26 and Smoothing at 9. MACD (Moving Averages Convergence / Divergence) issued a buy signal on Apr 11. The buy signal rose on Wednesday.
Ultimate Oscillator: The Ultimate Oscillator settings are: Period 1 is 5, Period 2 is 10, Period 3 is 15, Factor 1 is 4, Factor 2 is 2 and Factor 3 is 1. These are not the default settings but are the settings I use with the S&P 500 chart set for 1 to 3 months. The Ultimate Oscillator signal is positive and falling.
Slow Stochastic: For the Slow Stochastic I use the K period of 14 and D period of 3. The Slow Stochastic tries to predict the market direction further out than just one day. The Slow Stochastic has an up signal in place and is overbought. There is a possible sell signal developing as you can see in the Slow Stochastic chart this evening.
Relative Strength Index: The relative strength index is set for a period of 5 which gives it 5 days of market movement to monitor. It is often the first indicator to show an overbought or oversold signal. The RSI signal is rising.
Rate of Change: Rate Of Change is set for a 21 period. This indicator looks back 21 days and compares price action from the past to the present. With the Rate Of Change, prices are rising when signals are positive. Conversely, prices are falling when signals are negative. As an advance rises the Rate Of Change signal should also rise higher, otherwise the rally is suspect. A decline should see the Rate Of Change fall into negative signals. The more negative the signals the stronger the decline. The rate of change is rising but negative.
Support Levels To Be Aware Of:
2745 to 2750 was light support
2710 was light support.
2700 is support.
2675 is light support.
2650 is light support and 2620 is also light support.
2600 is good support.
There is good support at the 2550 level from where the market bounced back from the recent correction on Feb 9.
The S&P has light support at 2480. It also has light support at 2450 and good support at 2425. Below that there is some support at 2400, 2380, 2350. 2300 has the most support at present but would represent a full correction as a drop to this level would be 20% and just 5% away from a potential bear market signal.
Stock Market Outlook for Tomorrow – Thu Apr 19 2018
The technical indicators are showing signs of concern for Thursday. All signals are weaker for Thursday except for MACD and the Slow Stochastic. The chart itself looks negative for Thursday as the index is set to turn lower for the day.
The S&P may open higher on Thursday, but I expect the market will move lower by the close.
Stock Market Outlook Archives
Stock Market Outlook for Fri Apr 19 2024 – Deeply Oversold – Bounce Likely – Higher Close

Morning Investing Strategy Notes for Thu Apr 18 2024

Stock Market Outlook for Thu Apr 18 2024 – Deeply Oversold – Bounce Attempt Expected

Morning Investing Strategy Notes for Wed Apr 17 2024
Stock Market Outlook for Wed Apr 17 2024 – Another Bounce Attempt

Morning Investing Strategy Notes for Tue Apr 16 2024
Stock Market Outlook for Tue Apr 16 2024 – Deeply Oversold
Morning Investing Strategy Notes for Mon Apr 15 2024
Stock Market Outlook for Mon Apr 15 2024 – Expect A Bounce

Morning Investing Strategy Notes for Fri Apr 12 2024
Stock Market Outlook for Fri Apr 12 2024 – All About Bank Earnings

Morning Investing Strategy Notes for Thu Apr 11 2024
Stock Market Outlook for Thu Apr 11 2024 – Weakness and Lower

Morning Investing Strategy Notes for Wed Apr 10 2024
Stock Market Outlook for Wed Apr 10 2024 – All About The CPI Numbers
