
Friday saw the second largest down day for the S&P this year. Fear caused by the so-called “inverted yield curve” and worries of an impending recession sent investors to the exits on Friday.
The selling was just a day after investors had jumped into stocks and pushed the indexes to their highest levels this year and since October 10.
My outlook was for some morning selling with a dip slightly larger than prior days but then a push to close slightly positive on the day. Instead the early morning dip became deeper until by the afternoon the index sold off into the close hitting the lowest levels of the day. Overall it was a dismal day for the bulls.
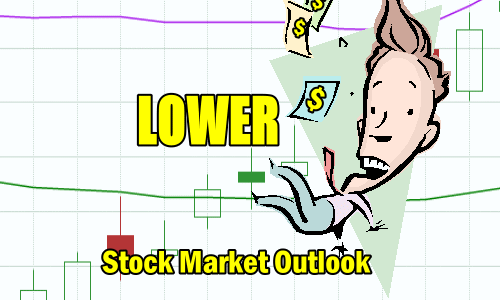
Stock Market Outlook Chart Comments At The Close on Fri Mar 22 2019
The Index now has 6 buy signals in place with the final buy signal released on Thursday Mar 21.
This had set the S&P up for a return to the bullish pattern of the 21 day, followed by the 50 day, 100 day and then 200 day moving averages. As well Thursday was a big up day.
Fears of a recession though, hit investors hard and selling fed into more selling. This left behind a large bearish candlestick for Monday. It also left behind a Bollinger Bands Squeeze that now appears ready to send stocks lower.
The chart looks bullish except for the past three days. But the index is now turned toward a bearish outlook, at least for the next few trading days.

Stock Market Outlook review of Fri Mar 22 2019
Stock Market Outlook: Technical Indicators Review:
Momentum: Momentum is positive and falling.
- Settings: For momentum I use a 10 period when studying market direction.
MACD Histogram: MACD (Moving Averages Convergence / Divergence) issued an up signal on Tuesday March 19 2019. On Friday the signal changed to down but it is not yet confirmed. That may happen on Monday.
- Settings: For MACD Histogram, I am using the Fast Points set at 13, Slow Points at 26 and Smoothing at 9.
Ultimate Oscillator: The Ultimate Oscillator signal is positive and falling rapidly.
- Settings: The Ultimate Oscillator settings are: Period 1 is 5, Period 2 is 10, Period 3 is 15, Factor 1 is 4, Factor 2 is 2 and Factor 3 is 1. These are not the default settings but are the settings I use with the S&P 500 chart set for 1 to 3 months.
Slow Stochastic: The Slow Stochastic has a down signal in place for Monday and is overbought. It had predicted the pullback of Friday but I felt the pullback would not happen until Monday.
- Settings: For the Slow Stochastic I use the K period of 14 and D period of 3. The Slow Stochastic tries to predict the market direction further out than just one day.
Relative Strength Index: The RSI signal is falling rapidly.
- Settings: The relative strength index is set for a period of 5 which gives it 5 days of market movement to monitor. It is often the first indicator to show an overbought or oversold signal.
Rate of Change: The rate of change signal is falling, indicating that prices should be moving lower at the start of the week.
- Settings: Rate Of Change is set for a 21 period. This indicator looks back 21 days and compares price action from the past to the present. With the Rate Of Change, prices are rising when signals are positive. Conversely, prices are falling when signals are negative. As an advance rises the Rate Of Change signal should also rise higher, otherwise the rally is suspect. A decline should see the Rate Of Change fall into negative signals. The more negative the signals the stronger the decline.
Support Resistance Levels To Be Aware Of:
2900 is strong resistance
2860 is resistance
2830 is light support
2800 is strong support
2795 is light support
2745 to 2750 is light support
2725 is light support
2700 is light support
2675 is light support
2650 is support
2625 is light support
2600 is support.
There was good support at the 2550 level which is back to being support.
The 2500 level is support.
The S&P has light support at 2480 and better support at 2450.
There is good support at 2425.
Below that there is some support at 2400, 2380, 2350.
2300 has the most support at present but would represent a full correction of 641 points as a drop to this level would be 21% and just 5% away from a full bear market signal ending the bull market from 2009.
Stock Market Outlook for Tomorrow – Mon Mar 25 2019
The indicators have turned bearish and are predicting another down day for Monday.
All the indicators have changed. We could see a rally attempt in the mid-morning but overall the day looks set to close lower.
The next level of support is at 2700 and from there the index could easily slide to 2600 which is strong support.
Stock Market Outlook Archives
Stock Market Outlook for Wed Apr 24 2024 – Some Weakness But Higher Close

Morning Investing Strategy Notes for Tue Apr 23 2024

Stock Market Outlook for Tue Apr 23 2024 – Bounce But Lower

Morning Investing Strategy Notes for Mon Apr 22 2024
Stock Market Outlook for Mon Apr 22 2024 – No Change – Deeply Oversold Bounce Possible

Morning Investing Strategy Notes for Fri Apr 19 2024
Stock Market Outlook for Fri Apr 19 2024 – Deeply Oversold – Bounce Likely – Higher Close

Morning Investing Strategy Notes for Thu Apr 18 2024
Stock Market Outlook for Thu Apr 18 2024 – Deeply Oversold – Bounce Attempt Expected
Morning Investing Strategy Notes for Wed Apr 17 2024
Stock Market Outlook for Wed Apr 17 2024 – Another Bounce Attempt

Morning Investing Strategy Notes for Tue Apr 16 2024
Stock Market Outlook for Tue Apr 16 2024 – Deeply Oversold
Morning Investing Strategy Notes for Mon Apr 15 2024
Stock Market Outlook for Mon Apr 15 2024 – Expect A Bounce
