

On Friday stocks opened flat and then spent the remainder of the day climbing. The afternoon was especially strong as once the 3930 level held throughout the lunch hour, investors were emboldened and snapped up stocks that had fallen just a day earlier. The SPX pushed its way to 3972 for a gain of 74 points on the day. Selling in the afternoon was very minor. Up volume was 85% on Friday. For the week the S&P was down just 26 points.
The NASDAQ had a strong day climbing 288 points to end the week at 11,140, up 61 points on the week and closing once again above 11,000.
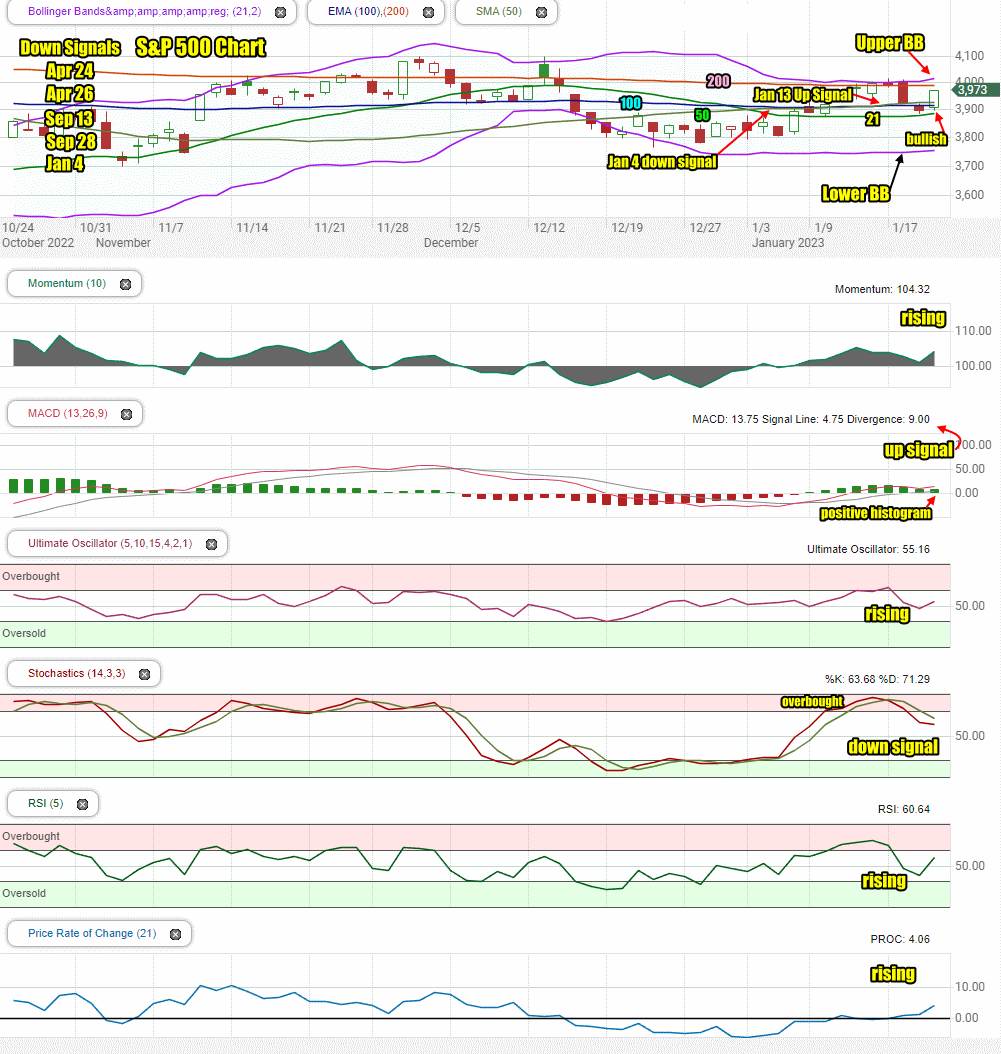
Let’s review the closing technical indicators from the SPX on Fri Jan 20 to see what to expect for Mon Jan 23 2023.
Stock Market Outlook Chart Comments At The Close on Fri Jan 20
On Fri Jan 20 the S&P rose above the 50 and 100 day moving averages and closed just below the 200 day. This is bullish.
The closing candlestick is bullish for Monday but also signals the morning may see some weakness. A dip as low as 3940 or even 3930 would not be unusual.
The Upper Bollinger Band is turned higher on Friday which is bullish and the Lower Bollinger Band is rising which is also bullish.
The 200 and 100 day moving averages are falling which is bearish but the 21 day is turning back up and the 50 day moved above the 100 day on Friday Jan 13 for a new up signal.
At present there are are 5 down signals in place since April 24 and one up signal.
The chart is 60% bearish for Monday which is an improvement from Friday’s open.
Stock Market Outlook review of Fri Jan 20 2023
Stock Market Outlook: Technical Indicators Review:
Momentum: Momentum is rising and positive.
- Settings: For momentum I use a 10 period when studying market direction.
MACD Histogram: MACD (Moving Averages Convergence / Divergence) issued an up signal on Monday Jan 9. The up signal regained some strength on Friday. The histogram also regained some strength.
- Settings: For MACD Histogram, I am using the Fast Points set at 13, Slow Points at 26 and Smoothing at 9.
Ultimate Oscillator: The Ultimate Oscillator is rising and back positive.
- Settings: The Ultimate Oscillator settings are: Period 1 is 5, Period 2 is 10, Period 3 is 15, Factor 1 is 4, Factor 2 is 2 and Factor 3 is 1. These are not the default settings but are the settings I use with the S&P 500 chart set for 1 to 3 months.
Slow Stochastic: The Slow Stochastic has a strong down signal in place and is not signaling overbought.
Settings: For the Slow Stochastic I use the K period of 14 and D period of 3. The Slow Stochastic tries to predict the market direction further out than just one day.
Relative Strength Index: The RSI signal is rising sharply and back positive.
- Settings: The relative strength index is set for a period of 5 which gives it 5 days of market movement to monitor. It is often the first indicator to show an overbought or oversold signal.
Rate of Change: The rate of change signal is rising and positive. It is signaling that a bigger move is coming for the index.
- Settings: Rate Of Change is set for a 21 period. This indicator looks back 21 days and compares price action from the past to the present. With the Rate Of Change, prices are rising when signals are positive. Conversely, prices are falling when signals are negative. As an advance rises the Rate Of Change signal should also rise higher, otherwise the rally is suspect. A decline should see the Rate Of Change fall into negative signals. The more negative the signals the stronger the decline.
Support and Resistance Levels To Be Aware Of:
4050 is resistance
4030 is resistance
4025 is resistance
4000 is resistance
3975 is resistance
3965 is resistance
3950 is resistance
3930 is light support
3900 is light support
3875 is light support
3850 is good support
3830 is good support
3810 is light support
3800 is good support
3775 is good support
3750 is good support
3730 is light support
3725 is light support
3715 is light support
3700 is good support
3685 is light support
Stock Market Outlook for Tomorrow – Mon Jan 23 2023
The technical signals gained a lot of strength in Friday’s rally. Only the Slow Stochastic continues to points lower for stocks. The Relative Strength Index (RSI) rose sharply and the Rate Of Change is pointing to a large move coming for the S&P. With so many investors and analysts still bearish, that move could be to the upside which would surprise many.
New 52 week highs are now continuing to outpace new lows which is a good sign for the bulls.
This week is heavy on earnings from a variety of companies. Analysts have reduced their outlook which may make it easier for stocks to beat estimates. That will be bullish for stocks.
Meanwhile Alphabet announced layoffs in what appears to be a haphazard fashion angering many employees. A total of 6% of its workforce is expected to be cut. This may weigh on stocks on Monday or just tech stocks. Other investors may see it as a bullish sign to improve the bottom line. They may surprise and buy shares expecting the stock to move higher in coming weeks.
In general the outlook for Monday is a flat open, some weakness which could be deeper than expected, even down to 3940 or 3930 would not be a surprise and then a higher close. Momentum is strongly bullish to start off the week. I plan to use dips on Monday to setup trades.
Potential Economic and Political Market Moving Events
There are a number of events this week that may impact stocks. Thursday and Friday are particularly heavy with reports.
Monday:
10:00 Leading economic indicators are expected to come in at -0.7%, which is better than the prior reading of -1.0%.
Stock Market Outlook Archives
Stock Market Outlook for Fri Apr 19 2024 – Deeply Oversold – Bounce Likely – Higher Close

Morning Investing Strategy Notes for Thu Apr 18 2024

Stock Market Outlook for Thu Apr 18 2024 – Deeply Oversold – Bounce Attempt Expected

Morning Investing Strategy Notes for Wed Apr 17 2024
Stock Market Outlook for Wed Apr 17 2024 – Another Bounce Attempt

Morning Investing Strategy Notes for Tue Apr 16 2024
Stock Market Outlook for Tue Apr 16 2024 – Deeply Oversold
Morning Investing Strategy Notes for Mon Apr 15 2024
Stock Market Outlook for Mon Apr 15 2024 – Expect A Bounce

Morning Investing Strategy Notes for Fri Apr 12 2024
Stock Market Outlook for Fri Apr 12 2024 – All About Bank Earnings

Morning Investing Strategy Notes for Thu Apr 11 2024
Stock Market Outlook for Thu Apr 11 2024 – Weakness and Lower

Morning Investing Strategy Notes for Wed Apr 10 2024
Stock Market Outlook for Wed Apr 10 2024 – All About The CPI Numbers
