
 On Thursday stock indexes moved higher with the S&P up 18 points by the close ending the day at 4419. The Dow rose 153 points to close at 35,084 and the NASDAQ rose just 15 points ending the day at 14,778.
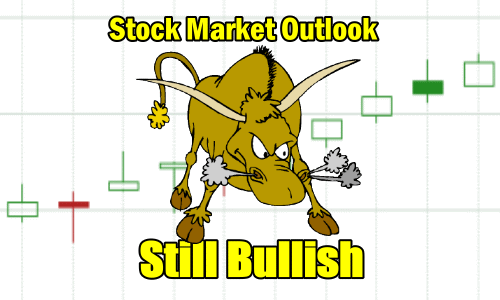
Let’s review the technical indicators at the close on Thursday to see what investors should expect for Friday, the final trading day of July.
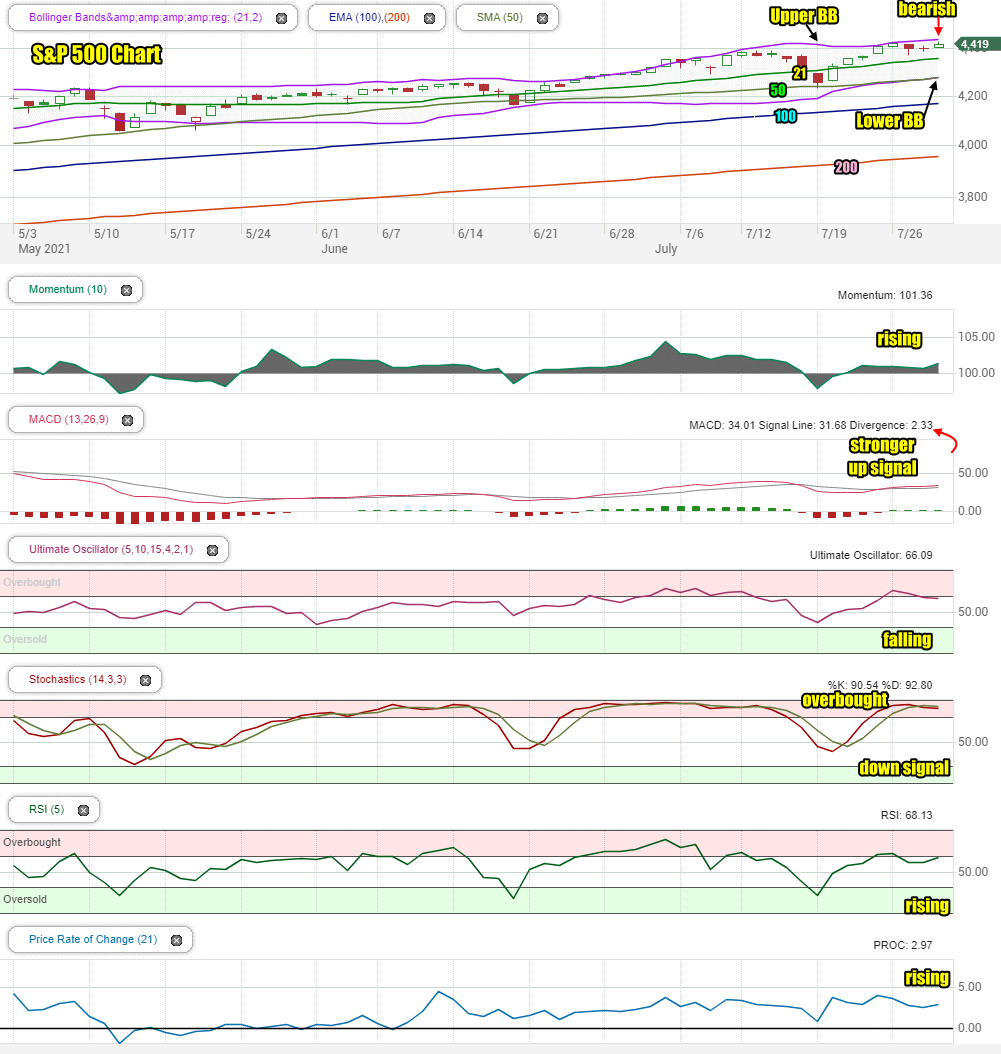
Stock Market Outlook Chart Comments At The Close on Thu Jul 29 2021
On Thursday the S&P traded higher but was unable to hold the highs of the day. This left behind a bearish candlestick for Friday which is warnings that Friday will be lower.
The Upper Bollinger Band is still climbing while the Lower Bollinger Band is stuck at the 50 day moving average. Both signals are more bullish than bearish at present.
All the major moving averages are still climbing which is bullish. The chart is dominantly bullish for the final trading day of July.
Stock Market Outlook review of Thu Jul 29 2021
Stock Market Outlook: Technical Indicators Review:
Momentum: Momentum is rising and positive.
- Settings: For momentum I use a 10 period when studying market direction.
MACD Histogram: MACD (Moving Averages Convergence / Divergence) issued an up signal on Mon Jul 26. On Thursday the up signal strengthened.
- Settings: For MACD Histogram, I am using the Fast Points set at 13, Slow Points at 26 and Smoothing at 9.
Ultimate Oscillator: The Ultimate Oscillator is falling for a third straight day.
- Settings: The Ultimate Oscillator settings are: Period 1 is 5, Period 2 is 10, Period 3 is 15, Factor 1 is 4, Factor 2 is 2 and Factor 3 is 1. These are not the default settings but are the settings I use with the S&P 500 chart set for 1 to 3 months.
Slow Stochastic: The Slow Stochastic still has a down signal in place and is overbought.
Settings: For the Slow Stochastic I use the K period of 14 and D period of 3. The Slow Stochastic tries to predict the market direction further out than just one day.
Relative Strength Index: The RSI signal is rising and near overbought levels once again.
- Settings: The relative strength index is set for a period of 5 which gives it 5 days of market movement to monitor. It is often the first indicator to show an overbought or oversold signal.
Rate of Change: The rate of change signal is rising indicating we will see prices make a bigger move, either up or down, on Friday. Combined with the closing candlestick, this signal is bearish.
- Settings: Rate Of Change is set for a 21 period. This indicator looks back 21 days and compares price action from the past to the present. With the Rate Of Change, prices are rising when signals are positive. Conversely, prices are falling when signals are negative. As an advance rises the Rate Of Change signal should also rise higher, otherwise the rally is suspect. A decline should see the Rate Of Change fall into negative signals. The more negative the signals the stronger the decline.
Support and Resistance Levels To Be Aware Of:
4400 is resistance
4370 is resistance
4350 is light support
4300 is light support
4290 is light support
4270 is light support
4250 is light support
4225 is light support
4200 is light support
4175 is light support
4150 is light support
4100 is good support
4070 is light support
4050 is light support
4000 is good support
3900 is support
3850 is support
3800 is support
3750 is good support
3700 is light support
3680 is light support
3600 is strong support
Stock Market Outlook for Tomorrow – Fri Jul 30 2021
For Friday, the technical indicators are not quite as mixed as they were at the close on Wednesday although there are some strong down signals in play as well.
The new up signal from the MACD indicator, gained strength on Thursday. The Rate Of Change is advising investors that we will see bigger price swings on many stocks on Friday. Those swings could be lower based on the closing candlestick.
Poor earnings results from Amazon and Pinterest saw both stocks collapse after hours on Thursday. For Friday this could be an impetus lower, at least at the open. The closing candlestick would definitely agree with that outlook.
At the same time, we are scheduled to receive more earnings on Friday before the open from the likes of big names like Caterpillar, AbbVie, Chevron, Exxon Mobil and Procter and Gamble. If earnings are better than expected this could be enough to turn the tide on early morning selling and push for a higher close. Historically the final trading day of July has been bearish 60% of the time over the past 18 years. So while there is a strong chance Friday will see a move lower, even if history repeats itself, the underlying current is still very bullish.
Stock Market Outlook Archives
Stock Market Outlook for Fri Apr 19 2024 – Deeply Oversold – Bounce Likely – Higher Close

Morning Investing Strategy Notes for Thu Apr 18 2024

Stock Market Outlook for Thu Apr 18 2024 – Deeply Oversold – Bounce Attempt Expected

Morning Investing Strategy Notes for Wed Apr 17 2024
Stock Market Outlook for Wed Apr 17 2024 – Another Bounce Attempt

Morning Investing Strategy Notes for Tue Apr 16 2024
Stock Market Outlook for Tue Apr 16 2024 – Deeply Oversold
Morning Investing Strategy Notes for Mon Apr 15 2024
Stock Market Outlook for Mon Apr 15 2024 – Expect A Bounce

Morning Investing Strategy Notes for Fri Apr 12 2024
Stock Market Outlook for Fri Apr 12 2024 – All About Bank Earnings

Morning Investing Strategy Notes for Thu Apr 11 2024
Stock Market Outlook for Thu Apr 11 2024 – Weakness and Lower

Morning Investing Strategy Notes for Wed Apr 10 2024
Stock Market Outlook for Wed Apr 10 2024 – All About The CPI Numbers
