

On Thursday the S&P spent the day in a fairly tight trading range and closed up 29 points. The NASDAQ rose 123 points. Volumes on both indexes were again lower as many investors continue to wait for next week’s inflation report and the Fed’s decision on interest rates. Many analysts and investors continue to expect markets to move lower while there are still some analysts expecting the index to hold, climb and then rally at month end providing the market with another Santa Claus Rally.
Let’s review the technical indicators at the close on Thu Dec 8 2022 to see what to expect for Fri Dec 9 2022.
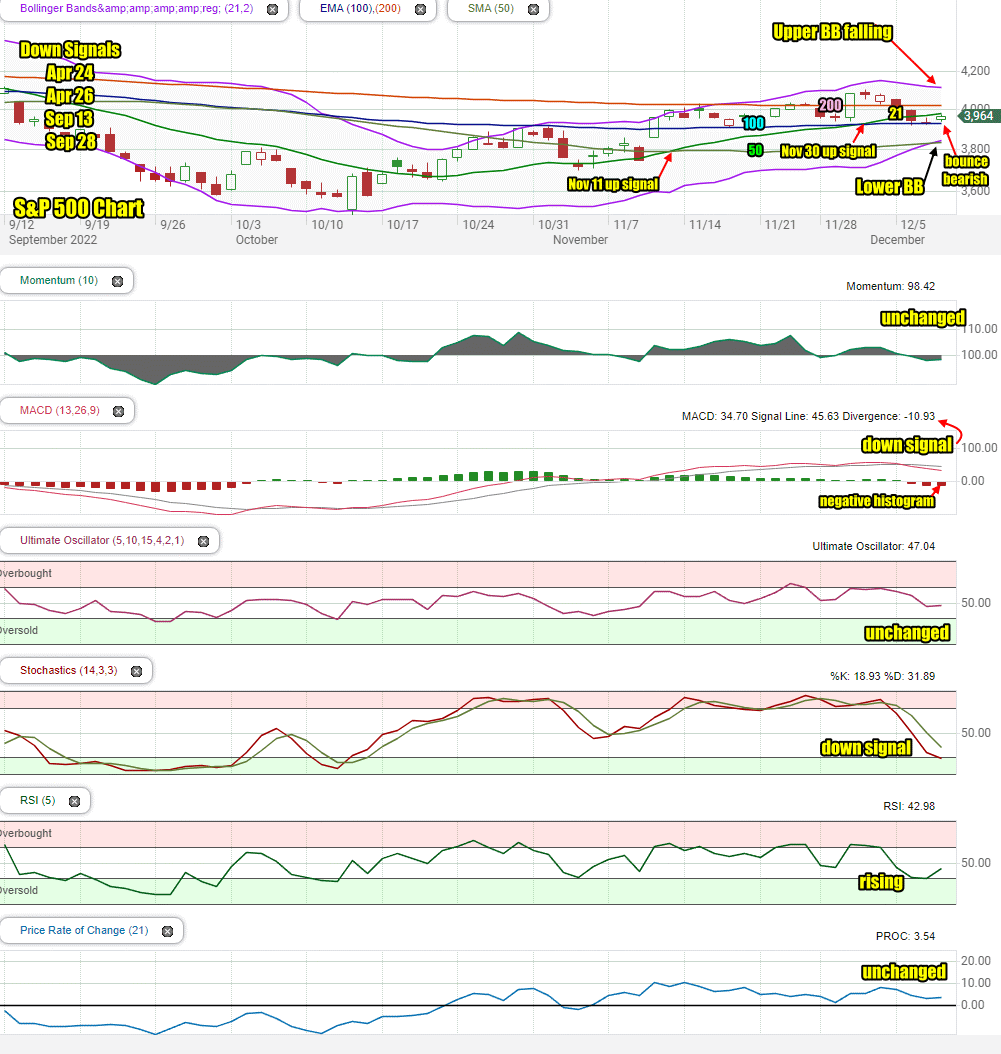
Stock Market Outlook Chart Comments At The Close on Thu Dec 8 2022
On Thursday the S&P closed below the 200 day, 21 day but above the 100 day moving average. This is bearish. The closing candlestick is bearish but also signaling a potential for the market to continue to bounce on Friday.
The Upper Bollinger Band crossed above the 200 day on Wednesday November 16 which is a bullish signal. On Thursday the Upper Bollinger Band continued moving lower and the Lower Bollinger Band is still rising and is above the 50 day moving average. This is presently bearish as the index enters a Bollinger Bands Squeeze.
A second up signal was generated on Wednesday Nov 30, with the 21 day moving above the 100 day.
The first up signal was Friday Nov 11 when the 21 day moving average moved above the 50 day.
The 21 day, 50 day and 100 day moving averages are turning higher which is bullish. The 200 day is trending sideways which is neutral.
There are now 4 down signals in place since April 24 and two up signals.
The chart though is 80% bearish for Friday.
Stock Market Outlook review of Thu Dec 8 2022
Stock Market Outlook: Technical Indicators Review:
Momentum: Momentum is unchanged and negative.
- Settings: For momentum I use a 10 period when studying market direction.
MACD Histogram: MACD (Moving Averages Convergence / Divergence) issued a down signal Tuesday Dec 6 2022. On Thursday the down signal gained some strength. The histogram is negative.
- Settings: For MACD Histogram, I am using the Fast Points set at 13, Slow Points at 26 and Smoothing at 9.
Ultimate Oscillator: The Ultimate Oscillator is unchanged and negative.
- Settings: The Ultimate Oscillator settings are: Period 1 is 5, Period 2 is 10, Period 3 is 15, Factor 1 is 4, Factor 2 is 2 and Factor 3 is 1. These are not the default settings but are the settings I use with the S&P 500 chart set for 1 to 3 months.
Slow Stochastic: The Slow Stochastic has a down signal in place.
Settings: For the Slow Stochastic I use the K period of 14 and D period of 3. The Slow Stochastic tries to predict the market direction further out than just one day.
Relative Strength Index: The RSI signal is rising.
- Settings: The relative strength index is set for a period of 5 which gives it 5 days of market movement to monitor. It is often the first indicator to show an overbought or oversold signal.
Rate of Change: The rate of change signal is unchanged.
- Settings: Rate Of Change is set for a 21 period. This indicator looks back 21 days and compares price action from the past to the present. With the Rate Of Change, prices are rising when signals are positive. Conversely, prices are falling when signals are negative. As an advance rises the Rate Of Change signal should also rise higher, otherwise the rally is suspect. A decline should see the Rate Of Change fall into negative signals. The more negative the signals the stronger the decline.
Support and Resistance Levels To Be Aware Of:
4150 is resistance
4120 is resistance
4100 is resistance
4090 is resistance
4070 is resistance
4050 is resistance
4030 is resistance
4025 is light support
4000 is light support
3975 is light support
3965 is light support
3950 is good support
3925 is light support
3900 is good support
3875 is light support
3850 is light support
3830 is light support
3810 is light support
3800 is good support
Stock Market Outlook for Tomorrow – Fri Dec 9 2022
For Friday the technical indicators are still bearish but they are becoming more mixed after Thursday positive close. The i index is back above 3950 which is an important support level for the SPX.
The indicators that are bearish are gaining more strength to the downside despite Thursday higher close. The closing candlestick is advising that Friday could still see the bounce continue despite the strong bearish bias.
Potential Economic and Political Market Moving Events
Today’s is this week’s biggest events. The PPI, consumer sentiment and 5 year inflation expectations could move the markets.
Friday:
8:30 Producer price index is expected to be 0.2%
10:00 University of Michigan consumer sentiment index is expected to be 56.5
10:00 University of Michigan 5 year inflation expectations
10:00 Wholesale inventories revision is expected to come in at 0.8%
Stock Market Outlook Archives
Stock Market Outlook for Fri Apr 19 2024 – Deeply Oversold – Bounce Likely – Higher Close

Morning Investing Strategy Notes for Thu Apr 18 2024

Stock Market Outlook for Thu Apr 18 2024 – Deeply Oversold – Bounce Attempt Expected

Morning Investing Strategy Notes for Wed Apr 17 2024
Stock Market Outlook for Wed Apr 17 2024 – Another Bounce Attempt

Morning Investing Strategy Notes for Tue Apr 16 2024
Stock Market Outlook for Tue Apr 16 2024 – Deeply Oversold
Morning Investing Strategy Notes for Mon Apr 15 2024
Stock Market Outlook for Mon Apr 15 2024 – Expect A Bounce

Morning Investing Strategy Notes for Fri Apr 12 2024
Stock Market Outlook for Fri Apr 12 2024 – All About Bank Earnings

Morning Investing Strategy Notes for Thu Apr 11 2024
Stock Market Outlook for Thu Apr 11 2024 – Weakness and Lower

Morning Investing Strategy Notes for Wed Apr 10 2024
Stock Market Outlook for Wed Apr 10 2024 – All About The CPI Numbers
