
Wednesday saw another new intraday high in the SPX but Fed comments on the pandemic posing considerable risks to the economic outlook was a good enough reason for investors to sell out and send the index lower in the final hour of trading. All 3 indexes ended the day with losses.
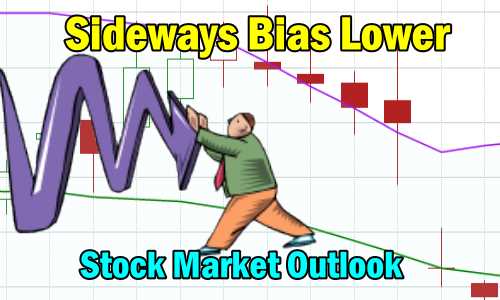
Stock Market Outlook Chart Comments At The Close on Wed Aug 19 2020
The index for the past 4 days has been warning of a potential down day coming so Wednesday’s decline is not much of a surprise.
The closing candlestick on Wednesday is bearish for a fourth straight day. Note that while the Upper Bollinger Band continues to rise, the Lower Bollinger Band could easily cross above the 50 day which would give investors a down signal.
There are still 6 up signals and one down signal caused when the Lower Bollinger Band moving above the 100 day moving average back on July 27. At present the Lower Bollinger Band is trending just below the 50 day moving average and as explained above, it could easily move above the 50 day giving us a new bearish signal.
The 21, 50, 100 and 200 day moving averages are continuing to climb. The SPX chart is still more bullish than bearish but a number of the technical indicators are turning bearish.

Stock Market Outlook review of Wed Aug 19 2020
Stock Market Outlook: Technical Indicators Review:
Momentum: Momentum is falling but still positive.
- Settings: For momentum I use a 10 period when studying market direction.
MACD Histogram: MACD (Moving Averages Convergence / Divergence) issued an up signal on Monday Aug 3. On Wednesday the up signal is almost gone. We could get a down signal on Thursday.
- Settings: For MACD Histogram, I am using the Fast Points set at 13, Slow Points at 26 and Smoothing at 9.
Ultimate Oscillator: The Ultimate Oscillator is falling.
- Settings: The Ultimate Oscillator settings are: Period 1 is 5, Period 2 is 10, Period 3 is 15, Factor 1 is 4, Factor 2 is 2 and Factor 3 is 1. These are not the default settings but are the settings I use with the S&P 500 chart set for 1 to 3 months.
Slow Stochastic: The Slow Stochastic has a weak down signal in place and is still overbought.
Settings: For the Slow Stochastic I use the K period of 14 and D period of 3. The Slow Stochastic tries to predict the market direction further out than just one day.
Relative Strength Index: The RSI signal is falling.
- Settings: The relative strength index is set for a period of 5 which gives it 5 days of market movement to monitor. It is often the first indicator to show an overbought or oversold signal.
Rate of Change: The rate of change signal is falling which indicates little change in prices is expected.
- Settings: Rate Of Change is set for a 21 period. This indicator looks back 21 days and compares price action from the past to the present. With the Rate Of Change, prices are rising when signals are positive. Conversely, prices are falling when signals are negative. As an advance rises the Rate Of Change signal should also rise higher, otherwise the rally is suspect. A decline should see the Rate Of Change fall into negative signals. The more negative the signals the stronger the decline.
Support and Resistance Levels To Be Aware Of:
3400 is resistance
3375 is resistance
3300 is resistance
3275 is support
3200 is support
3150 is support
3050 is support
3000 is support
2975 is light support
2950 is light support
2900 is light support
2860 is light support
2840 is light support
2800 is good support
2725 is light support
2700 is light support and marked a drop of 20.4%.
2500 was good support and marked a correction of 26.3%
2191 was the market low on March 23
Stock Market Outlook for Tomorrow – Thu Aug 20 2020
For Thursday the chart is once again more bearish and the technical indicators are now all showing signs of weakness. Part of this is the overbought condition of the index as it makes new highs.
With technical indicators pointing lower, Thursday could end lower but remember that a lot of investors are using the dips to jump into positions and we may see that again on Thursday.
The outlook then is for a choppy day with dips and a potential negative close, just remember, dips are being bought by investors so stay cautious on being too bearish.
Stock Market Outlook Archives
Stock Market Outlook for Wed Apr 24 2024 – Some Weakness But Higher Close

Morning Investing Strategy Notes for Tue Apr 23 2024

Stock Market Outlook for Tue Apr 23 2024 – Bounce But Lower

Morning Investing Strategy Notes for Mon Apr 22 2024
Stock Market Outlook for Mon Apr 22 2024 – No Change – Deeply Oversold Bounce Possible

Morning Investing Strategy Notes for Fri Apr 19 2024
Stock Market Outlook for Fri Apr 19 2024 – Deeply Oversold – Bounce Likely – Higher Close

Morning Investing Strategy Notes for Thu Apr 18 2024
Stock Market Outlook for Thu Apr 18 2024 – Deeply Oversold – Bounce Attempt Expected
Morning Investing Strategy Notes for Wed Apr 17 2024
Stock Market Outlook for Wed Apr 17 2024 – Another Bounce Attempt

Morning Investing Strategy Notes for Tue Apr 16 2024
Stock Market Outlook for Tue Apr 16 2024 – Deeply Oversold
Morning Investing Strategy Notes for Mon Apr 15 2024
Stock Market Outlook for Mon Apr 15 2024 – Expect A Bounce
