
When markets correct, I have a distinct advantage over many investors who own stocks. I sell options for income. That means I am holding put positions at put strikes where I would own a stock, not where the stock was trading at the time I sold the option. I don’t hold any stock in the collapse watching it day after day lose value. Instead I am holding short put positions that I can roll-down, roll-out, increase in size, decrease in size or use dozens of other strategies to protect my capital from losses. I definitely have a distinct advantage.
To continue to enjoy that same advantage it is important that I adjust my trade should the need arise. Let’s look at a few examples of some current trades in the ongoing correction for some further ideas.
Closing Trades Early
If there is one thing I continue to stress, it is the importance of closing short put positions early. In bull markets the tendency is to let the trade expire out of the money. That’s fine when the market is not overvalued but since December I have stresses the importance of closing trades for profits and moving on.
In a downturn or correction like the present one, closing trades becomes even more important.
Jan 30 Trade: Goldman Sachs Stock (GS)
On Tuesday January 30 I sold 5 of the Feb 9 expiry $257.50 put strike for average of $1.112 and bought 5 of the $235 put strike on Jan 31 for 8 cents.
The stock market outlook for Jan 31 was “Bounce Likely But Still Lower“.
That means start watching for opportunities to close trades that are profitable.
At the close of trading on January 31 the Stock Market Outlook Dashboard changed to down for short-term direction.
For Feb 1 the stock market out summary said “we should see the S&P try to stage a better rebound but there is a lot of weakness and we have a new sell signal from MACD to contend with. Overall markets look weak but often that’s when they are ready to bounce back. Thursday could be volatile with many big names reporting earnings and others reporting after the close. Friday we also get the unemployment numbers. Fed comments today definitely point to more interest rates likely in 2018 and that could in the end be what slows the bull market, perhaps this summer or into the fall. Treasury yields continue to rise which will also weigh on stocks if yields get too high too fast. All of this needs to be watched going forward”
So for Feb 1 another bounce attempt but still weakness. Again that means look for trades to close early.
On Feb 1 I closed the 5 $257.50 put positions for 37 cents at 3:03. The long puts however I am holding still as they are trading for 80 cents at the close. This locks in a profit of 64% and ended the riskier side of the trade.
On Friday I before markets opened I discussed closing trades early or rolling them if caught in the money.
Rolling In The Money Short Puts
Let’s take the same Goldman Sachs Stock (GS) trade and consider the trade as of Monday Feb 5.
Some investors emailed in who rolled down early in the day as the stock was falling. A number bought and closed the $257.50 put strike for Feb 9 and then waited a bit before reselling again.
For example, one member bought and close mid-morning for $1.90 and another closed for $3.00 early in the lunch hour. Then in the later afternoon one member rolled down to the $225 put strike and out to March 16 expiry selling the put strike for $2.15. They added 2 puts to the put strike roll-down as at $2315, they want to own shares.
The other member who bought over the lunch hour to close his $257.50 put strike, rolled down to $237.50 and sold the Mar 23 expiry for $2.78 within less than hour after closing the $257.50 put strike. Again, he indicate he picked a point he would own shares at.
Rolling Strategies
These investors rolled out and down. But one investor added a couple more short puts which increases the amount of capital at risk, while the other investor stayed with the same number of puts. Both earned more profits on the roll-down.
Why Not Reduce Capital At Risk
Rolling down and out is always a good strategy and it can be repeated often. It is rare to be assigned shares in a downturn if you move further out in time to extend the expiry period. However why not reduce the amount of capital at risk to free up capital to get ready for the eventual bounce or the recovery when it happens.
One of the better ways to do this is to always make sure the original trade was done at a price point you would own the stock at.
Let’s look at Goldman Sachs Stock (GS) again from Mon Feb 5 2018. The stock closed down at $249.11. The $257.50 put strike closed at $8.80.
That’s a very cost but this is what volatility does.
If I had sold 5 at $257.50 put strike for Feb 9 expiry, it would cost me $4000.00 to buy and close the trade. $8.00 X 5 contracts X 100 = $4000.00.
When I sold them originally I made $1.112 X 5 X 100 = $556.00. It will cost $400 to buy them back. Now you know why closing trades early for profits is important.
However I have said enough about the importance of closing early. If an investor did not close he could move to June 15 expiry at the $255 put strike which is at $16.90 at the close. I could sell 3 of the $255 put strike for June 15 and earn $16.90 X 3 X 100 = $5070.00.
This immediately would free up 2 put strikes and reduce my risk. The freed up capital can now be used for other trades in coming days.
Consider The Leaps
If you know you want to eventually own stock or would own Goldman Sachs Stock (GS) if you were unable to roll put positions forward, why not consider the leaps?
Leap Idea 1
If I had sold 5 at $257.50 put strike for Feb 9 expiry, it would cost me $4000.00 to buy and close the trade on Monday Feb 5. $8.00 X 5 contracts X 100 = $4000.00.
Leap Idea 2
I could decide that I would own the stock at $250. The $250 put strike for Jan 18 2019 is $25.01. Just two of these would earn $5002. This reduces my risk from 5 short puts down to 2 short puts.
As well I could combine 1 short put at $250 for $25.01 which would earn $2501.00 and then to make up the $1500 which was spent to close the Feb 9 $257.50 put strike I could sell 2 of the Apr 20 expiry $245 put strike for $10.20. This would earn $2040.00 which would more than pay for the $4000 cost to close the trade for Feb 9.
Summing Up
I prefer reducing capital at risk during periods of corrections or weakness such as we are presently seeing simply because it gives me more capital to use when stocks begin to recover or for when a stock I follow falls so low that I feel it is worth selling put options at a strike where I would not roll it lower but be comfortable owning shares at that price point.
A good example would be AT&T Stock. This chart is from the Tomorrow’s Trade Portfolio for today (Feb 5). If the stock fell to $33.50 I would sell put options out to June or further out at the $33.00 or $32.50 put strike, whichever would be available. At $32.50 I would be happy even if the stock fell to $28, because at $28, I would simply sell more puts for an equal number of shares.
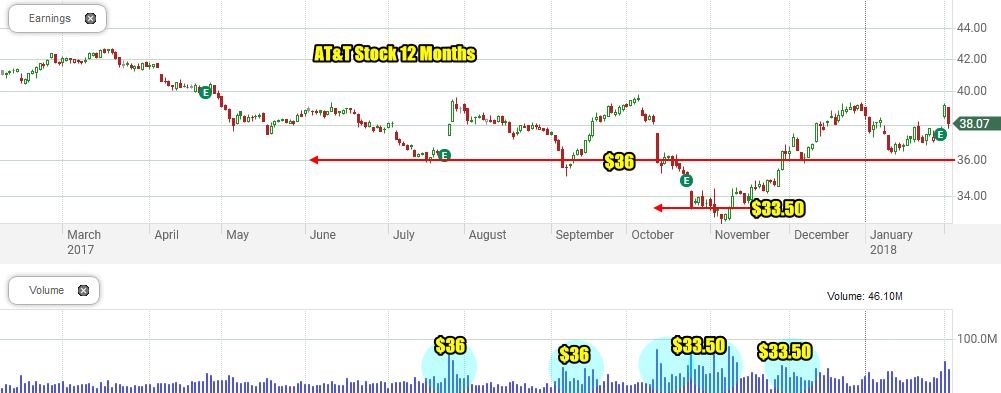
AT&T Stock to Feb 2 2018
Below are 5 more tips from a prior article on how to sell options in volatile markets.
5 Tips For Selling Options In Volatile Markets
There are a number of problems many investors face when selling options for income in markets such as the one we are presently in. Much of the time investors end up losing capital through taking losses on short option trades as stocks swing up and down daily. This roller coaster ride is not the easiest for many investors to stomach. But there are some tips that can help.
1) Stay With Large Cap Stocks
When markets are highly volatile, many investors are drawn to the option premiums that are often higher with speculative stocks and juniors. Remember that higher option premiums are a result of higher levels of risk. In a strong pullback almost all stocks fall but speculative stocks and juniors tend to fall the most. Keep your focus on large cap stocks, particularly those with a long track record of recovering from pullbacks and corrections that is at least 10 years in duration. As well where possible, select stocks paying a dividend that they have carried forward for more than 10 years. Move away from commodity type stocks or those with just one or two products they depend on for income. These types of stocks have a history of recovering and the dividend can assist while waiting for a stock to recover.
2) Sell Options At Strikes You Would Own A Stock At
Sell options, either puts or calls at strikes you would own shares at if assigned. This makes it much easier to repair a trade or hold it until recovery. Consider every stock and whether you would add more capital to repair a trade in specific stocks. If your answer is no, move to other stocks that you would place more capital in, if the stock declined.
3) Reduce The Trade Size To Keep Cash Back
Thanks to higher volatility, option premiums are higher which makes it profitable to sell fewer contracts. By reducing the number of contracts I am selling I am increasing the amount of capital I have out of the market. This is important for rescue strategies should the market fall further and also for taking advantage of large dips and pullbacks.
4) Where Possible Stay With Shorter Expiry Periods
Whenever possible, shorten the length of time to expiry by being willing to accept less profit for a shorter expiration date.
5) Learn To Take Profits Often – Don’t Hold Into Expiry
Last is to learn to take profits often and don’t hold trades into expiry. In a market with high volatility, there are many days when the market will swing 2 to 3 percent in a day and stocks can tumble or rise 5 percent or more. To remain consistently profitable investors need to learn to take profits early.Many investors end up with losses when selling options for income simply because they hold onto their naked put or naked call trades too long. Often a trade that started out profitably suddenly turns around and ends with losses being taken.
For example when I sell a naked put just two weeks away, I am hoping that the stock will stay above the put strike I sold. Each day that passes brings the trade closer to expiry and the put premium declines especially in the final few days before expiry, if the stock does not fall to the put strike I have sold. The problem is, even for a 2 week trade, stocks can tumble quickly on a daily basis. A trade that one day had less than 20 cents left of premium can suddenly have 90 cents a day later in a volatile market. This makes selling options for income very difficult and many investors take losses in these markets. They close their trades often too late and end up with either losses or very small gains.
Teddi’s Closing Early Spreadsheet
To control emotion and force trades to be closed early, I developed a simple spreadsheet years ago in Excel from Microsoft. My first spreadsheet was done in 1985 when Excel was released for the MAC. Later in 1987 I changed to windows when Excel was released for the PC. This spreadsheet assisted me greatly in the crash in 1987 and I have used in every year since. It was wonderful in 2000, 2001, 2002 and 2003 and again in 2007, 2008 and 2009.
This spreadsheet is available to Members who can download the spreadsheet sample I am discussing in this article, through this link. Investors using older versions of Excel can try this link which will download an .xls standard format. The password for the spreadsheet is fullyinformed19.
I appreciate those who keep the spreadsheet for their own use and do not post it to forums or other websites. My spreadsheet is set up containing three fictitious examples of, VISA, Intel and Exxon. To expand the spreadsheet members can simply copy the rows and paste them further down the sheet to accommodate as many trades as they want.
Remaining Aware Of Price Changes
The biggest problem for many investors is that once they have sold an option, whether it is a put or call, they do not remain aware of the day-to-day swings in option premiums. Almost all investors check their trades daily but price changes when options are sold in highly volatile markets are extremely important. A change of even 10 or 20 cents can make a huge impact on the final outcome. They can change a trade from a profit to a loss.
By using my spreadsheet I know instantly when the trade may be turning against me. I designed my spreadsheet to keep my focus on the trades I am in and the changes in option premiums. By noting the price changes in the option strike I sold and its premiums, I can see easily when a trade is working in my favor and when it is turning against me which immediately advises me to close my trade, take my profit and get out.
Each trade I enter, provides a percentage notification that I can quickly scan and know whether the trade needs to be closed or can be left longer in the hope of earning more of the original amount I sold the option for.
Reviewing The Spreadsheet
This spreadsheet can be downloaded through this link. For older formats of those investors needing a standard .xls format please select this link. The password for the spreadsheet is fullyinformed19. Once you have downloaded the spreadsheet you can remove the password or you can copy and paste the spreadsheet into your own Excel workbook.
Step 1: Enter Stock Data
My spreadsheet shows 3 example stocks. The trade prices are fictitious and are examples only. Any part of the spreadsheet can be expanded upon by an investor. For my purposes, the simpler the sheet is, the quicker and easier I can scan it. The first fields are basic. I place the name of the stock, its symbol, the approximate stock price at the time of my trade and the expiry date. The spreadsheet immediately advises me every day how many days are left until my short option trade expires. I show the strike I have sold, any comments or notes and the date the trade commenced.

Spreadsheet sample
Step 2: Enter Original Prices and Income Earned
I then enter the trade amounts in detail including number of contracts sold, price the option was originally sold at, commissions and the amount originally earned.
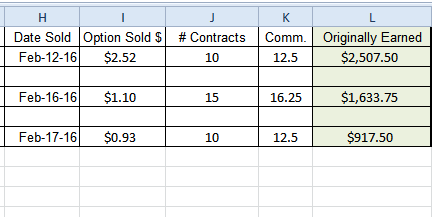
Step 2 – Entering Original Prices and Income Earned
The formula can be easily changed. I have it set for 75 cents per contracts and $5.00 per trade which seems to be a fairly common trade amount for many investors. Y0u can change it by selecting the commission cell and adjust those two amounts. If you have no per trade charge, then delete the +5 and remember to copy the change to the other two samples.
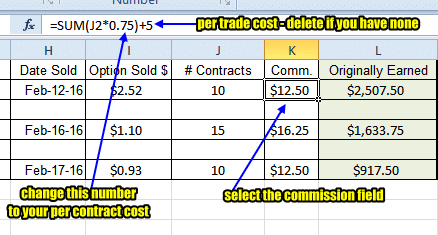
Changing the formula is easy
Step 3: Record The Daily Changes
There are three days in the table. You can easily copy and paste for more days however I have found 3 days to be sufficient. I place the date in the proper field, the stock price and the option price. The rest of the calculation is done automatically. It shows me how much of the original amount I sold the option for has been earned and what percentage of the trade has been gained or lost.
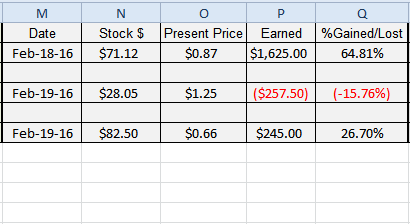
Step 3: record the daily changes – Day 1
There are two other days. I keep adjusting the data as the days progress to keep track of how well my option trades are performing despite the high volatility in the markets.
Day 2: Data is again added
Step 4: Using The “%Gained/Lost”
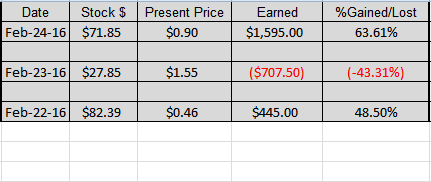
The key to the spreadsheet is watching the %Gained/Lost and comparing it to prior days. In the example spreadsheet below I have hidden quite a few of the fields ao I can show this image without your having to resize it. Remember, these are not actual trades but samples with fictitious amounts.

%Gained/Lost is key to knowing when to close the trade early
Understanding The Examples
VISA Example:
The VISA example shows that the original trade was for $2507.50 of income. By Feb 18 I had earned 64.81% of the trade. A few days later the amount earned was almost unchanged at 63.61%. I am watching the trade for signs of the stock recovering and the put premium climbing back up. For example if the next day I saw that I had earned just 51% of the trade, I will close it immediately since the day prior I had been “up” on the trade by 63.61%. On Feb 26 the trade has gained 91.92% and should be closed immediately as this trade does not expire until March 4, another week away. One week can make a huge difference in the outcome during periods of high volatility.

Visa Example
Intel Example:
The Intel example shows the original trade on Feb 16 was for $1633.75 of income but by Feb 19 the trade was down 15.76% and I had lost 257.50 of additional capital. In other words this trade will cost me more to close than I earned. I almost always will close the trade at the first sign of trouble when volatility is high. By Feb 23 the trade is down 43.31% and will cost me an additional $707.50 of my capital to close or a total of 2341.25. By Feb 23 then, I would have felt pretty poorly that I did not close the trade when it was down just 15% on Feb 19.
However by Feb 26 the trade is working out in my favor with a 54.93% gain instead of a loss. This is what volatility is like. It is also why I trade in stocks I would own. Intel for example is a stock I have quite a few open positions in. Some I would close if the trade turned against my position, but often since I am willing to own shares at the strikes I have sold options at, I will hold on and let the trade play out longer in the hope it will turn back in my favor. I would ONLY do this in stocks I would own.
If it does not, I often will try to roll out the trade, even if at the same strike.

Intel Example
Limited Capital Means Not Taking On Risk:
For most investors, especially those with limited capital, closing early and taking the smallest loss possible is, I believe, the better choice. This is because when the market turns lower it will take most stocks down with it. Those investors with limited free capital often find their capital is tied to declining stocks at much higher prices.
For example, in Dec 2015 many investors were selling put options in Intel stock at $32.50 to $33 with the stock trading above $34.00. They felt secure that the stock would not pullback. However between Dec 29 to Feb 11 Intel stock fell 22% to a low of $27.68. Those investors who were selling naked puts at $32.50 or even credit put spreads are holding large losses or have tried to roll-down and most likely far out in time, perhaps as far as July or even January 2017 to avoid stock ownership. Instead I want my capital free to trade at the $28.00 and below levels, not the $32.50 levels in a decline. To be able to do that with limited capital available means it is important to close a losing trade quickly for small losses and make that loss back when the stock nears a bottom in a downturn. For example by mid January an investor who possibly took a loss on their naked puts at $32.50 could have returned to selling the $28.00 or $27.50 put strike for large put premiums that would have more than made up for a small loss if the $32.50 naked puts had been closed early in the decline.
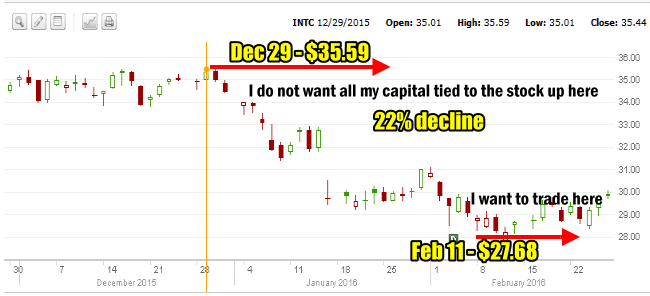
Intel 2016 decline of 22%
Intel In The 2008 Bear Market:
In 2008 for example, Intel fell from $24.50 to $13.00 from August to November. Tying up one’s capital above $20 meant not being able to take advantage of the stock at $13.00 which is a prime reason I have used this spreadsheet for 3 decades especially during periods of uncertainty and high volatility.
Exxon Mobil Stock:
The final stock is Exxon Mobil Stock which was traded on Feb 17 and again shows how the stock is moving obviously in my favor. By Feb 26 the %Gained/Lost is up 62.07%. This percentage might continue in my favor. For example perhaps on Monday Feb 29 it may show 73% and by Wednesday March 2 it could be 78% but then if on Thursday I see that it is 65% even if intraday, I close the trade and take my profit as the percentage gained would be moving “the wrong way”, basically earning less than it did on March 2 at 78%

Exxon Mobil Stock Example
Taking Profits Is Essential
Taking profits is essential. My spreadsheet is a very basic method that allows me to quickly recall how well a trade was doing and spot when a change happens. If adhered to, it removes emotions from the trade and forces me to close the trade, secure my profit or take a small loss and move on to another trade, because there is indeed always another trade.
One thing I always remember is that when a trade I have entered, especially when it is selling put options, fails, it is because the stock is falling further than I expected. That though may mean either a smaller profit than I had hoped, or even a small loss, but it also means there will be another opportunity when the downturn in the stock bottoms and often I end up being able to sell for better profits at a lower put strike.
Disclaimer: There are risks involved in all investment strategies and investors can and do lose capital. Trade at your own risk. Stocks, options and investing are risky and can result in considerable losses. None of the strategies, stocks or information discussed and presented are financial or trading advice or recommendations. Everything presented and discussed are the author’s own trade ideas and opinions which the author may or may not enter into. The author assumes no liability for topics, ideas, errors, omissions, content and external links and trades done or not done. The author may or may not enter the trades mentioned. Some positions in mentioned stocks may already be held or are being adjusted.
