FullyInformed.com

Market Timing System On Weekly Initial Unemployment Insurance Claims Show No Correction But Problems Remain

Jul 18, 2013 | Market Timing System, Stock Market Outlook

As regular readers know I use the Weekly Initial Unemployment Insurance Claims as part of the market timing system. You can review the entire strategy through this link. Suffice to say, anything below 350,000 a week in initial claims is considered bullish for stocks and anything above it is considered weak for stocks.

General Market Direction Trend

As well it is important to see that a trend is developing and continues to develop with regards to the Weekly Initial Unemployment Insurance Claims. Back in 2009 with the market direction collapsing, the Weekly Initial Unemployment Insurance Claims were climbing. It was not until those claims started to decline that the stock market turned back up.

market timing system - USA Initial Unemployment Insurance Claims

At present the trend is staying below 350,000 but the weekly numbers are not improving but instead moving sideways. For stocks to remain bullish the Weekly Initial Unemployment Insurance Claims needs to continue to decline until it gets below 300,000. From there it can trend sideways but for example, last week’s average was revised back to 351,250 which puts it in the corrective environment for stocks.

Any movement higher in the Weekly Initial Unemployment Insurance Claims almost always has been followed by weakness in stocks and a round of selling.

Current Market Direction Trend – Up

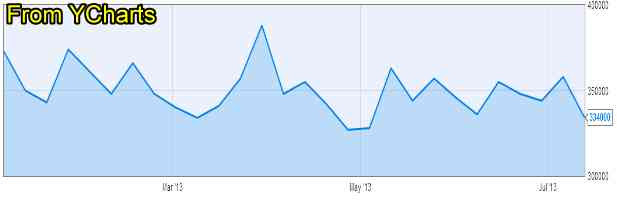
In the week ending July 13 the Weekly Initial Unemployment Insurance Claims was down 24,000 to 334,000. On the surface this looks good, but overall the 4 week moving average is at 346,000 which is just slightly below the 350,000 threshold where stocks enter selling periods.

Problems With Unemployment and Market Direction

While stocks keep flirting with all time highs, it is obvious from the unemployment figures that the stock market direction is high thanks to the stimulus efforts of the Federal Reserve.

For example, these two charts below from Ycharts show the problem being faced by unemployment statistics. While the numbers remains fairly decent, there are not really declining but are instead trending sideways. This is obvious from the weekly chart below. Only in April and May were there weekly periods with claims below 330,000. There have been no periods with claims down to the 300,000 mark.

Market Timing System Weekly Date Range

The graph below shows the Weekly Initial Unemployment Insurance Claims since January and you can see the sideways movement in the release of these figures and the stubbornness of unemployment to fall back to the 300,000 weekly initial claims level.

Market Timing System - weekly bar chartIncrease Versus Decrease in Unemployment Stats

Another area of concern is the number of states with increasing employment versus those with decreasing employment. For example the chart below from the US Labor Department website tells the ongoing problem with the unemployment statistics. To sum up the chart below, unemployment is still a major problem and many states are seeing more layoffs versus hirings.

Market Timing System and state unemployment

Market Direction To Keep A Watch On

All of this points to a juicing of the stock market through Fed activity. It should be remembered that the stock markets are very small in assets versus classes like Bonds. Therefore stocks are much easier to manipulate and Quantitative Easing programs impact the overall stock market far more than many other classes.

Therefore as long the Federal Reserve maintains its Quantitative Easing programs stocks should continue to do well, but when the scaling back does occur, stocks will most likely see a correction that could start slow and shallow but if the Weekly Initial Unemployment Insurance Claims start to rise and reach the 350,000 plus threshold, I will be adding additional protective measures to my positions and certainly buying Spy Put Options which have performed incredibly well when the Weekly Initial Unemployment Insurance Claims rise above the 350,000 price level.

Market Timing System And Investing Decisions

To sum it up then, it is important to watch the Weekly Initial Unemployment Insurance Claims for any sign that the trend is:

  • Not improving
  • Stats are rising toward 350,000
  • Stocks are stalling

When those three points occur watch MACD for a sell signal on the market direction before buying Spy Put Options or for those who follow my market direction portfolio, buying SDS or other ultra short type ETFs.

Internal Market Direction Links

Market Direction Portfolio Ongoing Trades (Members only)

Profiting From Understanding Market Direction (Articles Index)

Market Timing Articles Index

How I Use Market Timing

Understanding Short-Term Signals

Various Market Timing Systems

Search

Select to view all results...

Generic selectors
Exact matches only
Search in title
Search in content
Post Type Selectors

Recent Outlooks

Stock Market Outlook for Tue Apr 23 2024 – Bounce But Lower

Prior Trading Day Summary: Monday saw the long awaited bounce from the recent selling and market breadth was bullish. The SPX rose 43 points recovering all of Friday’s loss to close back above 5000 at 5010. The NASDAQ jumped 169 …

Morning Investing Strategy Notes for Mon Apr 22 2024

For FullyInformed Members the morning Investing Strategy Notes for Mon Apr 22 2024 discuss the outlook for the start of the fourth week of April. There are also comments on repairing positions using AMD and ARM as examples. There are …

Stock Market Outlook for Mon Apr 22 2024 – No Change – Deeply Oversold Bounce Possible

Prior Trading Day Summary: Friday saw stocks open flat and try to climb within the first 15 minutes. When that failed the selling continued. The early afternoon saw a rally attempt once the SPX fell below 5000 but the bounce …

Morning Investing Strategy Notes for Fri Apr 19 2024

For FullyInformed Members the morning Investing Strategy Notes for Fri Apr 19 2024 discuss the outlook for for a potential bounce that ends the day with the indexes positive. There are comments and trade ideas on Netflix Stock (NFLX), American …

Stock Market Outlook for Fri Apr 19 2024 – Deeply Oversold – Bounce Likely – Higher Close

Prior Trading Day Summary: Thursday saw another morning bounce attempt but no follow through. However the SPX did not break below 5000 and managed to close at 5011 although minutes before the close it was 5020 which would have turned …

Morning Investing Strategy Notes for Thu Apr 18 2024

For FullyInformed Members the morning Investing Strategy Notes for Thu Apr 18 2024 discuss the outlook for Thursday and a possible bounce or a move lower. There are trade ideas outlined in Netflix Stock (NFLX), American Express Company Stock (AXP) …

Stock Market Outlook for Thu Apr 18 2024 – Deeply Oversold – Bounce Attempt Expected

Prior Trading Day Summary: Wednesday saw a bounce attempt at the open which managed to reach 5078 before selling once again pushed stocks lower. By 12:45 stocks looks almost ready to break below 5000 but managed to find buyers who …

Morning Investing Strategy Notes for Wed Apr 17 2024

For FullyInformed Members the morning Investing Strategy Notes for Wed Apr 17 2024 discuss the outlook for a potential bounce on Wednesday. There are trade ideas outlined in Las Vegas Sands Stock (LVS), Alcoa Stock (AA), Discover Financial Stock (DFS) …

Stock Market Outlook for Wed Apr 17 2024 – Another Bounce Attempt

Prior Trading Day Summary: Tuesday found stocks stuck in a fairly tight trading range as investors remain worried about a potential Israeli retaliatory strike against Iran and what might be the implications. For much of the day the SPX trading …

Morning Investing Strategy Notes for Tue Apr 16 2024

For FullyInformed Members the morning Investing Strategy Notes for Tue Apr 16 2024 discuss the outlook for stocks for Tuesday and the chance of a bounce. There are trade ideas outlined in United Airlines Holdings Stock (UAL), Interactive Brokers (IBKR) …

Stock Market Outlook for Tue Apr 16 2024 – Deeply Oversold

Prior Trading Day Summary: Monday started the day as expected with a massive rally at the open and a push higher especially when retail sales came in stronger than expected. However as news continued to focus on Iran and Israel’s …

Morning Investing Strategy Notes for Mon Apr 15 2024

For FullyInformed Members the morning Investing Strategy Notes for Mon Apr 15 2024 discuss the outlook for stocks for Monday as well as the third week as a whole. There are trade ideas outlined in Goldman Sachs Stock (GS), Charles …

Stock Market Outlook for Mon Apr 15 2024 – Expect A Bounce

Prior Trading Day Summary: On Friday investors got better than expected bank earnings but sold bank stocks lower. The selling extended into other sectors until by the close the indexes were both down on the day and the week. The …

Morning Investing Strategy Notes for Fri Apr 12 2024

For FullyInformed Members the morning Investing Strategy Notes for Fri Apr 12 2024 discuss the CPI numbers released on Thursday and the outlook for stocks for the remainder of the week. There are trade ideas outlined in Progressive Stock (PGR), …