This is the sixth trade idea from a series of 10 trade article ideas for the end of January 2014.
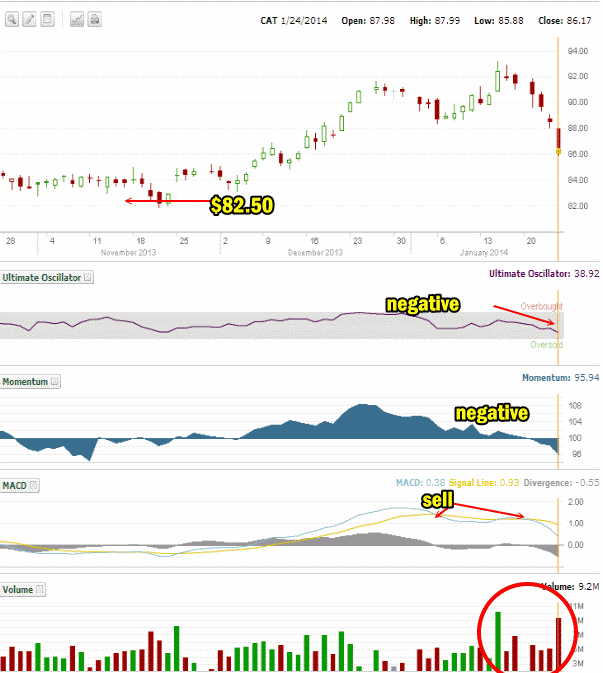
A trade I entered on Friday was selling the Feb 22 $82.50 put strike on Caterpillar Stock. Earnings were released this morning and beat analysts expectations. Forward guidance into 2014 was also strong. I think Caterpillar Stock will move higher, but then sell back. The stock is actually in a holding pattern. Let’s take a look at a couple of charts and you can see why I won’t sell above $82.50. For one thing, I have no interest in owning this stock. If ever I was assigned I would look for the first available opportunity to sell it and get out. That said, Caterpillar Stock has a great pattern for Put Selling as long as that pattern holds.
Caterpillar Stock 3 Month Chart
Over the past year I have sold primarily the $82.50 put strike. Even looking at the three-month chart below you can see that the stock has built up a support level around the $83.00 level. $82.50 was the low point in November before the stock rallied back up.
The Ultimate Oscillator though is negative and Momentum too is negative. If you look at momentum in the stock you can see that the late December rally in the stock saw good momentum, but then the rise higher in the stock is January saw declining momentum while the stock continued to move higher. This is a classic signal that the stock will fall. Declining momentum and yet a rising stock are clear warnings that the stock rally will fail. Despite that signal, look at volume for the last green candlestick in January. Huge buy volume and a declining momentum pattern. A lot of investors need to look at momentum. If they had they never would have bought the stock for prices over $92.00.
MACD has given two sell signals this month and refused to climb higher even though the stock did earlier this month. Again a classic warning of an impending pullback.
The last indicator is volume and you can see how negative it has been for 6 days as investors were worried going into earnings that the news would be bad. This was to be expected with all the bad news out of China and much of the developing world as Caterpillar earns a lot of its revenue outside North America.
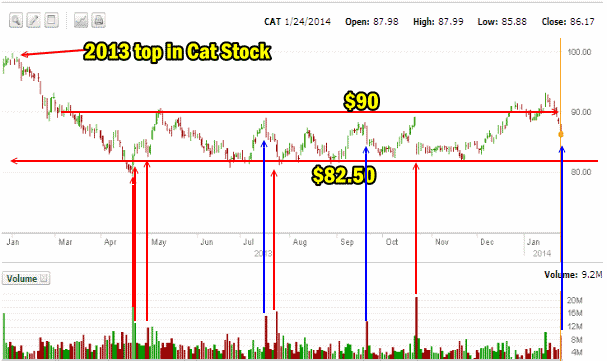
Caterpillar Stock One Year Chart
If we look at a longer term chart though, you can see why I have stayed with the $82.50 put strike for over a year now. After setting a high back at the start of 2013, caterpillar Stock has been stuck in a trading pattern with a lot just above the $82.50 level and below the $90 level. You can see in the red arrows pointing up from the volume indicator that a lot of traders realize this pattern as well and they have been busy buying the stock on each major dip in the stock over the past 12 months. The blue arrows indicate large volume when the stock was pulling back from a recent high. I did buy the stock a couple of times over the past 12 months based on the chart below and the Bollinger Bands Strategy Trade, overall though Put Selling has been incredibly profitable at that strike.
Caterpillar Stock Outlook and the $82.50 Put Strike
Whether this morning’s earnings will be strong enough to recover the stock to past glory days of January 2013, it in my opinion doubtful. Caterpillar stock was overvalued last January when it pushed toward the $100 valuation. Instead at $82.50, once I have sold puts, the position would be easy to defend. Meanwhile I have received a lot of emails this past year from investors who has been using the Walk That Profit Home To Momma strategy once they saw this pattern emerge. They are earning profits that are three and four times what I have earned.
Personally I think the stock has too much economic news to weather and today’s jump in the stock is welcomed but overall the stock will pull back either later this week or at the start of February in my opinion and I will be back selling the $82.50 put strike again.
Internal Stock and Option Trades Links
Put Selling Strategies For Members
Covered Calls Strategies For Members
Profit And Income Strategies Index
Stock and Option Strategies For Members
Stock And Option Trades Explained For Members