On October 31 I followed through on my article discussing stocks which might benefit from hurricane Sandy and did various trades. Around 11:10 Home Depot stock seemed to bottom and I sold 5 of the Nov 17 $60 put for .82 cents. I bought 10 of the Home Depot Stock $60 calls for Nov 17 for $2.02.
I felt Home Depot Stock calls made a lot of sense to buy. If the strategy was correct I expected the better move would be in buying Home Depot Stock calls. It was also the least capital intensive.
Selling 5 naked puts at $60.00 for .82 cents earned $410 against a possible assignment at $60 which would require $30,000 of capital to secure. The Home Depot Stock calls on the other hand were risking $2020.00 in total, but this is a full risk of loss should the stock not rise as I expect.

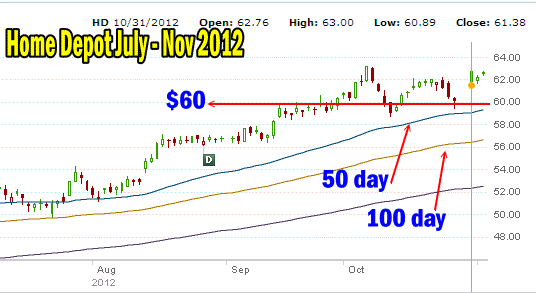
Home Depot July to Nov 2012
Home Depot Stock Chart
In the Home Depot Stock chart above you can see that Home Depot stock is near the highs for the year. It is however trending above the 50, 100 and 200 day moving averages signaling the stock is in an uptrend. The problem for me is that the stock rally has slowed considerably once it got over $60.00. The rally higher is facing headwinds which could make this trade difficult or unprofitable.
If the Hurricane strategy for Home Depot Stock can work I felt that Nov 17 expiry was the only month to select. This is because should Home Depot stock pull back and I have not enough time to get out of the trade, I stand to lose on the call options but I should have time to roll the Nov $60 puts out and down. I would definitely not be rolling these naked puts out in time at the same strike. I have no interest in owning shares of the stock so the strategy must be roll down and out. The focus, should the trade not work as planned, must be on capital preservation.
To view this Home Depot Stock trade in the USA Portfolio Index go to the date Oct 31 in the table.
Select this link to view all stock and option trades in my USA Portfolio for 2012.

