The NASDAQ has been one of the most important indicators of the present bull market since the market crash in 2008. The NASDAQ was the first index to signal the end of the bear market early in 2009 and has led stocks through the recovery and into the present bull market.
NASDAQ Index Chart To April 1 2016
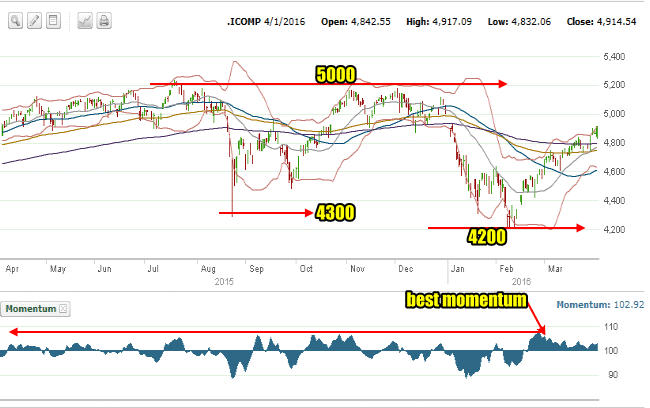
Since mid-2015 though there have been changes. You can see in the NASDAQ Index Chart that on July 20 the NASDAQ reached a high of 5231.94 which has been the highest level for the index. This broke the previous high set in March 2000 during the dot-com bubble days. Since July the index has been unable to recover and the index set up a pattern of lower highs until finally dropping below the 200 day moving average late last year.
In the NASDAQ Index Chart you can see that the drop in February 2016 was well below the August 2015 sell-off low which was just below 4300.
While the climb back from the February low of around 4200 has followed the S&P recovery, it has not been leading the markets but instead it has been following.

NASDAQ Index Chart to April 1 2016
NASDAQ Index Chart Momentum
Another interesting aspect of the above chart is the momentum indicator. Since the February recovery started the NASDAQ has experienced the best upside momentum is over a year. That momentum has dropped off considerably as the index climbed higher.
The rest of this Stock Market Outlook of the NASDAQ Index for the first week of April 2016 is for FullyInformed Members.
Stock Market Outlook – NASDAQ Index Chart For The First Week Of April 2016
Members can log in directly through this link to read the NASDAQ Chart Index for the first week of April 2016, or they can sign in to the full members site here. Non-members can join here or read about the benefits of a membership.
![]()
- Make or Break – Final Week Of February
- Watching The Trend – Third Week Of February
- Retest – Second Week Of February
- Oil, China, Earnings – First Week Of February

- Review Past Week Ahead Articles (listed recent to oldest)
Disclaimer: There are risks involved in all investment strategies and investors can and do lose capital. Trade at your own risk. Stocks, options and investing are risky and can result in considerable losses. None of the strategies, stocks or information discussed and presented are financial or trading advice or recommendations. Everything presented and discussed are the author’s own trade ideas and opinions which the author may or may not enter into. The author assumes no liability for topics, ideas, errors, omissions, content and external links and trades done or not done. The author may or may not enter the trades mentioned. Some positions in mentioned stocks may already be held or are being adjusted.
Market Direction Internal Links
Profiting From Understanding Market Direction (Articles Index)
Understanding Short-Term Signals
Market Direction Portfolio Trades (Members)
Market Direction External Links
Market Direction IWM ETF Russell 2000 Fund Info
Market Direction SPY ETF 500 Fund Info


