
The stock market outlook for Friday depended on the unemployment numbers. The numbers were shy of forecasts. They were though strong enough to show that the economy is continuing to grow jobs. They were also weak enough for investors to consider that the Federal Reserve may hold interest rate hikes beyond the expect hike in June. The first reaction to the Job’s numbers was for the market to decline. But investors decided to buy the decline and pushed the S&P back above 2050.
S&P Index Close
The S&P rebounded from 2039.45 in the morning to close up 6.51 points to 2057.14.
Dow Jones Index Close
The Dow Jones recovered from a morning low of 17,580.38 to close up 79.92 points to 17,740.63.
NASDAQ Index Close
The NASDAQ fell to 4684.28 in the morning on Friday but rallied to close up 19.06 points to 4,736.16.
Stock Market Outlook – Advance Decline Numbers
Volume was lower at 3.80 billion on Friday. By the close up volume made up 61% of all volume being traded and 62% of all stocks were rising. There were 172 new highs and 34 new lows.
The NASDAQ traded 1.86 billion shares. Up volume made up 45% of all volume with down volume close at 37%. There were 36 new highs and 86 new lows.
The stock market outlook from the advance decline numbers are still showing no clear signal back to up for the markets. There is still some strength which you can see from the new highs, but the NASDAQ is failing to keep pace with the rest of the market and that continues to warn investors to stay cautious.
Stock Market Outlook – Technical Indicators At The Close
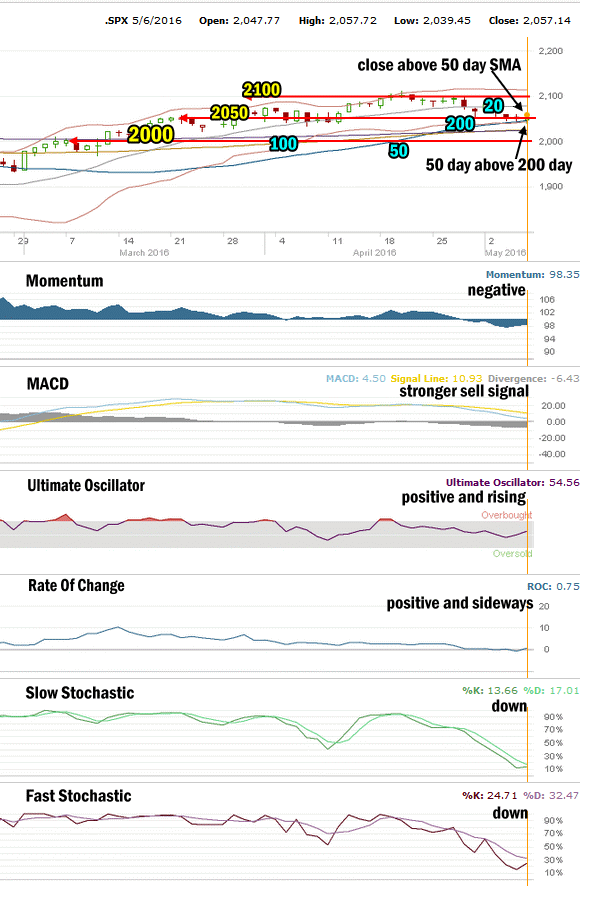
Stock Market Outlook – May 6 2016
Stock Market Outlook: Chart Comments:
The S&P closed above the 50 day simple moving average (SMA). The 50 day simple moving average (SMA) is still above the 200 day moving average and the 100 day moving average is ready to move above the 200 day. These are strong buy signals for the market.
The Bollinger Bands are still trending more sideways than up which points to stocks still moving sideways rather than higher. This could change to lower.
Stocks rebounded from falling to 2040 in the morning and closed back above the important 2050 level.
Stock Market Outlook: Support and Resistance Levels:
These are the present support and resistance levels. These levels have not changed since January 2015.
2100 is resistance.
2075 is light resistance. Below that is 2050 which is light support.
Better support is at 2000.
Weak support is at 1970 while stronger support is at 1956 and technically it is more important than 1970 for the market. 1940 is light support as is 1920. 1900 is more symbolic than anything else.
1870 is support. 1840 continues to be support. The 1820 level is light support. The strongest support level is at 1800.
1775 and 1750 are both critical support for the present bull market. While 1775 is important it is 1750 that is the bottom line.
A break of 1750 would mark a severe correction from the all-time high of 2134.72. This would be the biggest correction since the plunge in 2011 of a 20% pullback. A pullback to 1750 from the all-time high would be a drop of 384 points for a decline of 18%. A pull-back of that size would definitely stun investors and bring to question whether the bull market which started in 2009 is finished. From 1750 it is an easy slide to 1600 which was near the market top in 2007.
Stock Market Outlook Technical Signals
Momentum: For momentum I use a 10 period when studying market direction. Momentum is negative and starting to rise.
MACD Histogram: For MACD Histogram, I am using the Fast Points set at 13, Slow Points at 26 and Smoothing at 9. MACD (Moving Averages Convergence / Divergence) issued a sell signal on April 22. The sell signal is still strong on Friday.
Ultimate Oscillator: The Ultimate Oscillator settings are: Period 1 is 5, Period 2 is 10, Period 3 is 15, Factor 1 is 4, Factor 2 is 2 and Factor 3 is 1. These are not the default settings but are the settings I use with the S&P 500 chart set for 1 to 3 months. The Ultimate Oscillator is back positive and rising.
Rate of Change: Rate Of Change is set for a 21 period. The rate of change signal is positive and moving sideways.
Slow Stochastic: For the Slow Stochastic I use the K period of 14 and D period of 3. The Slow Stochastic tries to predict the market direction further out than just one day. The Slow Stochastic is signaling down for stocks but is trying to bounce.
Fast Stochastic: For the Fast Stochastic I use the K period of 20 and D period of 5. These are not default settings but settings I set for the 1 to 3 month S&P 500 chart when I have it set for daily views. The Fast Stochastic is signaling down for stocks and is also trying to bounce.
Stock Market Outlook for Tomorrow – Monday May 9 2016
The technical indicators at the close on Friday were 4 to 2 negative. However two of the negative indicators, namely the stochastic indicators, are both signaling that stocks could rebound on Monday.
The closing candlestick on Friday is often bullish. With oil prices set to rise due to the sacking of Saudi Arabia’s Oil Minister Ali al-Naimi and the continuing wildfires in Fort McMurray, Monday should see stocks try to rally, supported by higher oil prices. The day could be choppy. The opening may see a bounce and then a pullback followed by another rally attempt. The close though should be positive even if only slightly.
Stay FullyInformed With Email Updates
Market Direction Internal Links
Profiting From Understanding Market Direction (Articles Index)
Understanding Short-Term Signals
Market Direction Portfolio Trades (Members)
Market Direction External Links
IWM ETF Russell 2000 Fund Info
Market Direction SPY ETF 500 Fund Info