
 A lot of the trouble on Tuesday came from President Trump’s tweet regarding healthcare and a “system” to reduce prices for citizens. He tweeted that he’s working on a “new system where there will be competition in the drug industry.”
This pushed the healthcare sector lower with heavier losses taken by the pharmaceutical stocks.
Let’s look at the closings on Tuesday and then take a technical overview.
S&P Index Close
The S&P index ended the day down 6.92 points to close at 2368.39.
Dow Jones Index Close
The Dow Jones ended down 29.58 points to close at 20,924.76.
NASDAQ Index Close
The NASDAQ closed down 15.25 points to end the day at 5,833.93.
Stock Market Outlook
Stock Market Outlook review of Mar 7 2017
Chart Comments At The Close:
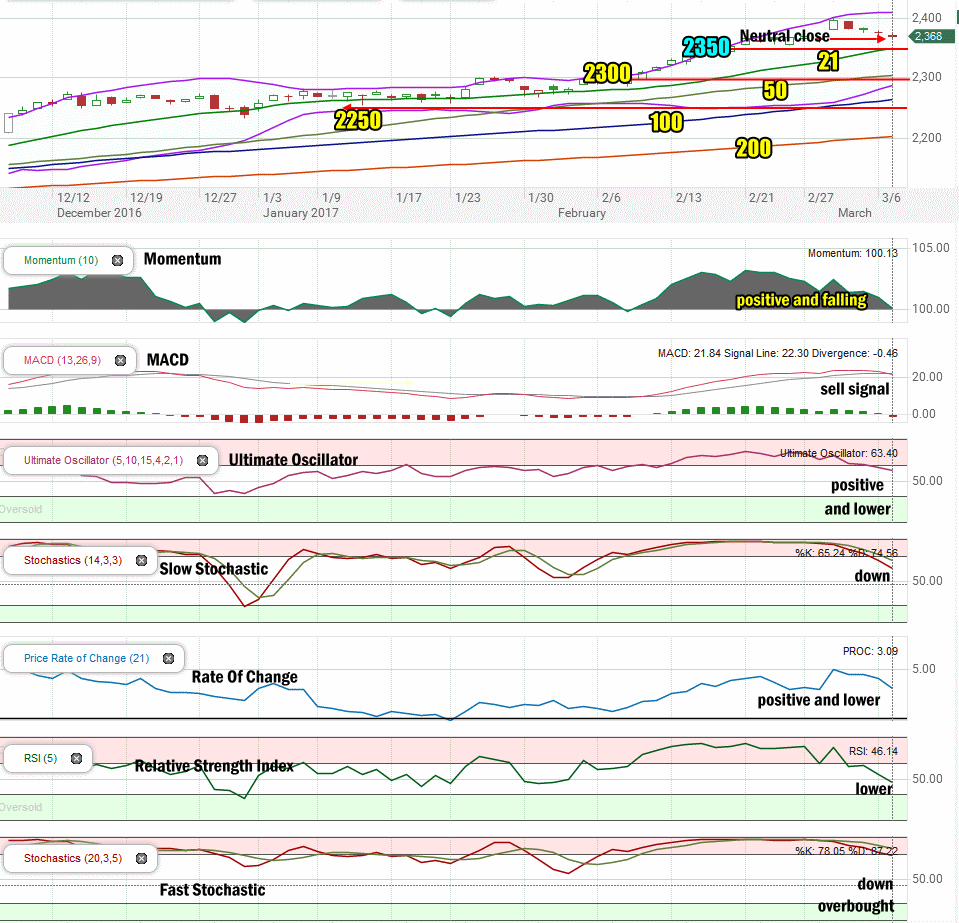
On Tuesday Mar 7 the S&P traded still lower below the Upper Bollinger Band and left behind a third neutral closing candlestick. It is still above the 21 day simple moving average (SMA). You can see in the chart a similar closing candlestick on Feb 28, 4 trading days earlier. That resulted in a jump higher by the S&P. Tomorrow we could see a similar attempt although there are more indications the S&P will reach the 21 day moving average first which is around 2350.
The Lower Bollinger Band which fell below the 50 day moving average is turning sharply back up which if it crosses the 50 day moving average and moves above it will be a bearish signal for the market. At present the market needs to hold the 2350 level which is the 21 day moving average or it risks falling deeper. I am expecting any move down to 2350 will result in a bounce.
The major moving averages are all still climbing which is bullish.
Stock Market Outlook: Technical Indicators:
Momentum: For momentum I use a 10 period when studying market direction. Momentum is barely positive having fallen steadily over the past 5 trading days.
MACD Histogram: For MACD Histogram, I am using the Fast Points set at 13, Slow Points at 26 and Smoothing at 9. MACD (Moving Averages Convergence / Divergence) issued a buy signal Feb 10 2017. At the close of trading on Tuesday a sell signal was issued. This needs to be confirmed.
Ultimate Oscillator: The Ultimate Oscillator settings are: Period 1 is 5, Period 2 is 10, Period 3 is 15, Factor 1 is 4, Factor 2 is 2 and Factor 3 is 1. These are not the default settings but are the settings I use with the S&P 500 chart set for 1 to 3 months. The Ultimate Oscillator is positive and falling.
Slow Stochastic: For the Slow Stochastic I use the K period of 14 and D period of 3. The Slow Stochastic tries to predict the market direction further out than just one day. The Slow Stochastic has a down signal in place.
Rate of Change: Rate Of Change is set for a 21 period. This indicator looks back 21 days and compares price action from the past to the present. The rate of change signal is positive and falling which would indicate prices are going to move lower before they will move back higher.
Relative Strength Index: The relative strength index is set for a period of 5 which gives it 5 days of market movement to monitor. It often is the first indicator to show an overbought or oversold signal. RSI has fallen dramatically. It is still at readings that signal further weakness should be expected.
Fast Stochastic: For the Fast Stochastic I use the K period of 20 and D period of 5. These are not default settings, but settings I use for the 1 to 3 month S&P 500 chart when I have it set for daily views. The Fast Stochastic has a down signal in place and is overbought.
Support Levels To Be Aware Of:
A bounce is possible off 2350 which is the 21 day moving average should the market fall that low.
The market has light support at the 2300 and the 2250 level. There is also light support at 2195 but better support is at 2180 and then 2150.
Stock Market Outlook for Tomorrow – Wednesday Mar 8 2017
The technical indicators for Wedneday are again weaker and there are now three sell signals in play. The sell signal from MACD is unconfirmed at the close of trading on Tuesday.
Overall the losses have been small over the past two trading days and the VIX index shows little concern about the pullback.
There is still a good chance for a rebound to occur but for Wednesday, more weakness definitely looks set to show up again in the morning. The afternoon could see the market try to regain its footing and try to close flat to positive but all the technical indicators are pointing to further weakness ahead for Wednesday Mar 8 2017.
Stay FullyInformed With Email Updates
Market Direction Internal Links
Profiting From Understanding Market Direction (Articles Index)
Understanding Short-Term Signals
Market Direction Portfolio Trades (Members)
Market Direction External Links
IWM ETF Russell 2000 Fund Info
Market Direction SPY ETF 500 Fund Info