
Friday was all about the unemployment numbers. When the report first came out the indexes all collapsed. Within minutes they have all made their lows for the day and spent the rest of the day climbing back up. All closed slightly lower.
S&P Index Close
The S&P fell to 2085.36 but quickly regained its footing and closed at 2099.13 although during the day it reached 2104.07. By the close the index was down by just 6.13 points.
Dow Jones Index Close
The Dow Jones opened and within minutes was looking at a triple digit loss down to 17,689.68. The rest of the day was spent with the index rallying to close at 17,807.76 down just 31.50 points.
NASDAQ Index Close
The NASDAQ opened lower as well but managed to follow the other two major indexes higher and close at 4942.52 down 28.85 points for a loss of 0.58%, the largest among the three indexes.
Stock Market Outlook – Advance Decline Numbers
The advance decline numbers were covered in the market breadth article indicator for the week ahead which can be reviewed through this link.
Stock Market Outlook – Technical Indicators At The Close
Stock Market Outlook – June 3 2016
Stock Market Outlook: Chart Comments:
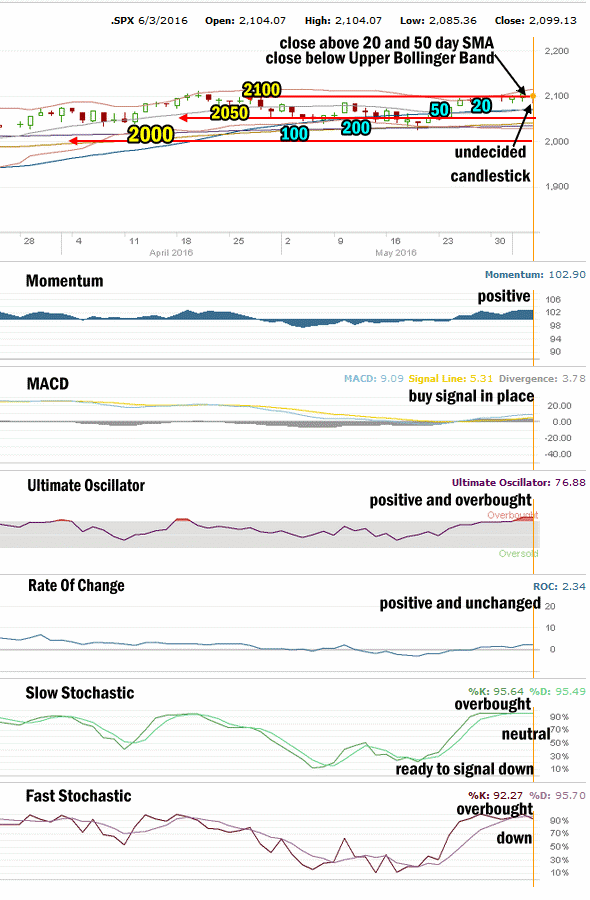
The S&P closed on Friday below the Upper Bollinger Band but above all the major moving averages. The closing candlestick however is undecided for Monday. The closing candlestick is referred to as a hanging man and often it can signal a move up or a move down. Monday’s market action will dictate what the hanging man candlestick is signaling.
The SPX continues to be led by the 50 day and then the 100 day both of which are rising which is an up signal for stocks.
The index is moving sideways rather than higher and has been for the past week.
Stock Market Outlook: Support and Resistance Levels:
These are the present support and resistance levels. These levels have not changed since January 2015.
2100 is resistance.
2075 is light support. Below that is 2050 which is light support.
There is light support at 2025.
Better support is at 2000.
Weak support is at 1970 while stronger support is at 1956 and technically it is more important than 1970 for the market. 1940 is light support as is 1920. 1900 is more symbolic than anything else.
1870 is support. 1840 continues to be support. The 1820 level is light support. The strongest support level is at 1800.
1775 and 1750 are both critical support for the present bull market. While 1775 is important it is 1750 that is the bottom line.
A break of 1750 would mark a severe correction from the all-time high of 2134.72. This would be the biggest correction since the plunge in 2011 of a 20% pullback. A pullback to 1750 from the all-time high would be a drop of 384 points for a decline of 18%. A pull-back of that size would definitely stun investors and bring to question whether the bull market which started in 2009 is finished. From 1750 it is an easy slide to 1600 which was near the market top in 2007.
Stock Market Outlook Technical Signals
Momentum: For momentum I use a 10 period when studying market direction. Momentum is positive and moving sideways.
MACD Histogram: For MACD Histogram, I am using the Fast Points set at 13, Slow Points at 26 and Smoothing at 9. MACD (Moving Averages Convergence / Divergence) issued a buy signal on May 25. The strength of the buy signal was unchanged on Friday.
Ultimate Oscillator: The Ultimate Oscillator settings are: Period 1 is 5, Period 2 is 10, Period 3 is 15, Factor 1 is 4, Factor 2 is 2 and Factor 3 is 1. These are not the default settings but are the settings I use with the S&P 500 chart set for 1 to 3 months. The Ultimate Oscillator is positive and very overbought.
Rate of Change: Rate Of Change is set for a 21 period. The rate of change signal is positive but moving sideways.
Slow Stochastic: For the Slow Stochastic I use the K period of 14 and D period of 3. The Slow Stochastic tries to predict the market direction further out than just one day. The Slow Stochastic is neutral for stocks and is overbought. It is on the verge of issuing a sell signal.
Fast Stochastic: For the Fast Stochastic I use the K period of 20 and D period of 5. These are not default settings but settings I set for the 1 to 3 month S&P 500 chart when I have it set for daily views. The Fast Stochastic is signaling down for stocks and is also overbought.
Stock Market Outlook for Tomorrow – Monday Jun 6 2016
For Monday the technical indicators are split. Only one is definitely negative, the Fast Stochastic and the Slow Stochastic is nearing a sell signal but remains somewhat neutral. The other 4 technical indicators are positive. This means that technically the market is 4 to 2 for more upside action.
Overall the move back up on Friday after the drop following the unemployment numbers, seems bullish. However often the rally like we saw on Friday is short-lived and stocks move lower.
I am expecting weakness at the start of the morning on Monday and then an attempt to turn positive and close above 2100.
Stay FullyInformed With Email Updates
Market Direction Internal Links
Profiting From Understanding Market Direction (Articles Index)
Understanding Short-Term Signals
Market Direction Portfolio Trades (Members)
Market Direction External Links
IWM ETF Russell 2000 Fund Info
Market Direction SPY ETF 500 Fund Info