
The close on Monday saw the S&P and Dow at all-time new highs. The NASDAQ still has a bit of ground to recover before it sets a new all-time high. Today’s advance was muted and on low volume which often makes it suspect for a pullback.
S&P Index Close
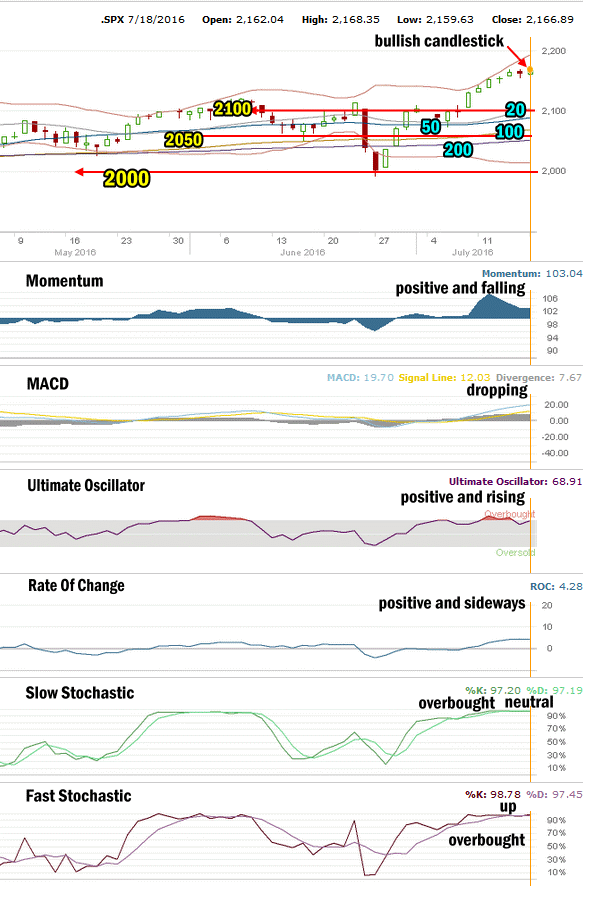
The S&P index spent most of the day around the 2164 to 2165 level. It closed up 5.15 points to 2,166.89.
Dow Jones Index Close
The Dow had a very slight gain rising 16.50 points to close at 18,533.05.
NASDAQ Index Close
The NASDAQ also had a small gain. It closed up 26.20 points to 5055.78.
Stock Market Outlook – Technical Indicators At The Close
Stock Market Outlook – Jul 18 2016
Stock Market Outlook: Chart Comments:
The S&P moved more sideways than up or down. The move higher was slight. However the closing candlestick was more bullish than the last three closing candlesticks.
The move today is further away from the Upper Bollinger Band. The index must now push higher or risks falling back. By watching the Upper Bollinger Band over the next day or two we should get a good indication if the rally will retrench a bit or move higher. If the Upper Bollinger Band starts to turn a bit sideways then we know there is a better than even chance the market will consolidate gains.
At present the Upper Bollinger Band is still pushing higher which points to further gains. We should have a better idea tomorrow by midday.
Stock Market Outlook: Support and Resistance Levels:
These are the present support and resistance levels. These levels have not changed since January 2015.
2100 has become light support.
2090 is very light support.
2075 is also light support
Below that is 2050 which is light support.
2025 is better support than 2050 through to 2090.
2000 is primary support.
Weak support is at 1970 while stronger support is at 1956 and technically it is more important than 1970 for the market. 1940 is light support as is 1920. 1900 is more symbolic than anything else.
1870 is support. 1840 continues to be support. The 1820 level is light support. The strongest support level is at 1800.
1775 and 1750 are both critical support for the present bull market. While 1775 is important it is 1750 that is the bottom line.
A break of 1750 would mark a severe correction from the all-time high of 2134.72. This would be the biggest correction since the plunge in 2011 of a 20% pullback. A pullback to 1750 from the all-time high would be a drop of 384 points for a decline of 18%. A pull-back of that size would definitely stun investors and bring to question whether the bull market which started in 2009 is finished. From 1750 it is an easy slide to 1600 which was near the market top in 2007.
Stock Market Outlook Technical Signals
Momentum: For momentum I use a 10 period when studying market direction. Momentum is positive and is now turning sideways which confirms the sideways move of the index itself.
MACD Histogram: For MACD Histogram, I am using the Fast Points set at 13, Slow Points at 26 and Smoothing at 9. MACD (Moving Averages Convergence / Divergence) issued a buy signal on July 1. The buy signal is starting to weaken.
Ultimate Oscillator: The Ultimate Oscillator settings are: Period 1 is 5, Period 2 is 10, Period 3 is 15, Factor 1 is 4, Factor 2 is 2 and Factor 3 is 1. These are not the default settings but are the settings I use with the S&P 500 chart set for 1 to 3 months. The Ultimate Oscillator is positive and back into overbought readings.
Rate of Change: Rate Of Change is set for a 21 period. The rate of change signal is positive and now moving sideways. Another confirmation of the sideways movement of the S&P.
Slow Stochastic: For the Slow Stochastic I use the K period of 14 and D period of 3. The Slow Stochastic tries to predict the market direction further out than just one day. The Slow Stochastic is extremely overbought and has a full neutral reading at the close.
Fast Stochastic: For the Fast Stochastic I use the K period of 20 and D period of 5. These are not default settings but settings I set for the 1 to 3 month S&P 500 chart when I have it set for daily views. The Fast Stochastic is also very oversold and is still pointing for higher prices on Tuesday.
Stock Market Outlook for Tomorrow – Jul 19 2016
The technical indicators are all still strongly positive but are continuing to show signs of weakness. The Fast Stochastic and the Slow Stochastic are reading very overbought and there is not much more room for these indicators to signal more upside ahead. Usually the readings we see tonight, point to weakness for the next day.
The market can stay overbought for quite a few days and can even push higher during that time period. But eventually, overbought signals end with the market pulling back and consolidating.
For Tuesday stocks still look set to try to keep the rally alive however my outlook is for more sideways action and a slightly lower close.
Stay FullyInformed With Email Updates
Market Direction Internal Links
Profiting From Understanding Market Direction (Articles Index)
Understanding Short-Term Signals
Market Direction Portfolio Trades (Members)
Market Direction External Links
IWM ETF Russell 2000 Fund Info
Market Direction SPY ETF 500 Fund Info