
 Wednesday saw markets once more choppy with worries over the Trump administration, Congressional confirmations and infighting as well as a mixed bag of earnings. This kept the indexes both in negative and positive territory.
Meanwhile factory activity hit a two plus year high and private payrolls beat estimates.
In the afternoon the Fed indicated that rates would remain untouched for now but that there is still evidence to support a tightening of monetary policy through 2017. This seemed to buoy investor confidence and stocks pushed higher, once again in the last hour or so of trading to end positive.
S&P Index Close
The S&P index ended the day up 0.68 points to 2279.55
Dow Jones Index Close
The Dow Jones ended up 26.85 to close at 19,890.94
NASDAQ Index Close
The NASDAQ closed up 27.86 points to end the day at 5642.65
Stock Market Outlook
Stock Market Outlook review of Feb 1 2017
Chart Comments At The Close:
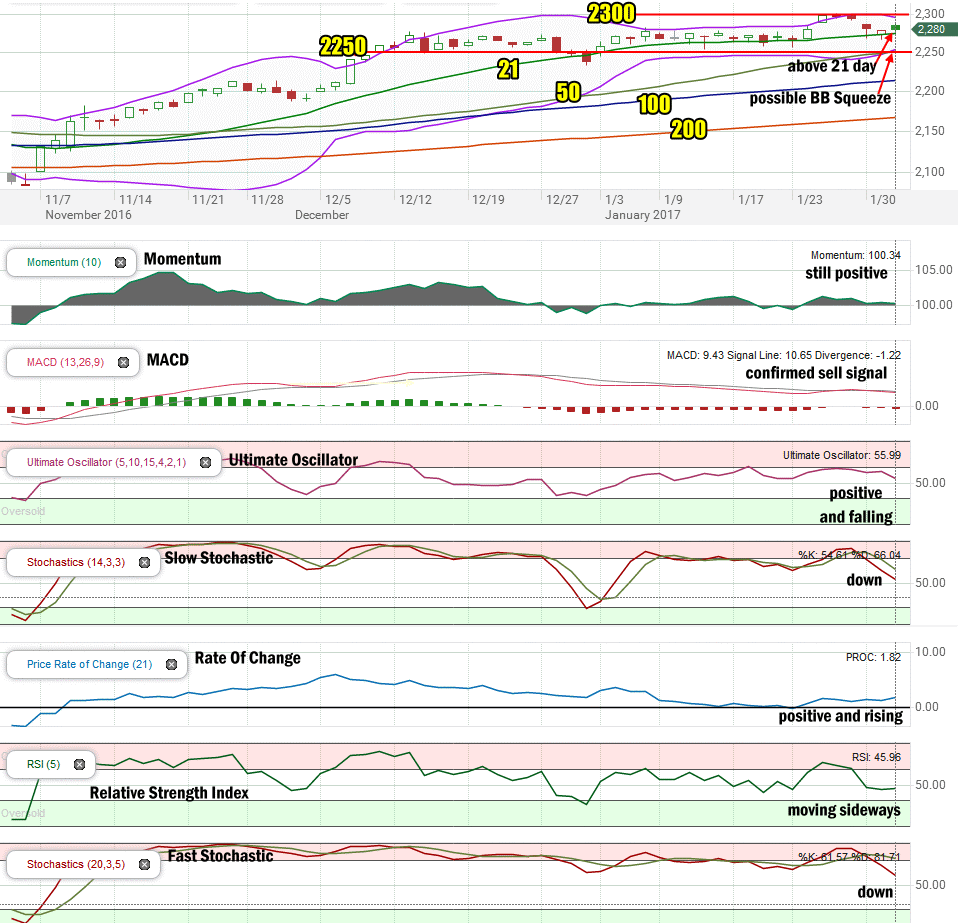
On Wednesday the S&P fell to the 21 day moving average for the third time this week and once again bounced off the 21 day to close above it. The resulting candlestick though is bearish for Thursday. You can see that another possible Bollinger Bands Squeeze is starting to form. The Lower Bollinger Band has moved above the 50 day moving average which is bearish for the index. The 2260 level continues to hold up well and the S&P closed near the 2800 level.
Stock Market Outlook: Technical Indicators:
Momentum: For momentum I use a 10 period when studying market direction. Momentum is still positive and moving sideways.
MACD Histogram: For MACD Histogram, I am using the Fast Points set at 13, Slow Points at 26 and Smoothing at 9. MACD (Moving Averages Convergence / Divergence) issued a sell signal Jan 30 2017 which was confirmed today.
Ultimate Oscillator: The Ultimate Oscillator settings are: Period 1 is 5, Period 2 is 10, Period 3 is 15, Factor 1 is 4, Factor 2 is 2 and Factor 3 is 1. These are not the default settings but are the settings I use with the S&P 500 chart set for 1 to 3 months. The Ultimate Oscillator is positive and falling lower.
Slow Stochastic: For the Slow Stochastic I use the K period of 14 and D period of 3. The Slow Stochastic tries to predict the market direction further out than just one day. The Slow Stochastic has a down signal in place.
Rate of Change: Rate Of Change is set for a 21 period. This indicator looks back 21 days and compares price action from the past to the present. The rate of change signal is positive and trying to rise.
Relative Strength Index: The relative strength index is set for a period of 5 which gives it 5 days of market movement to monitor. It often is the first indicator to show an overbought or oversold signal. It is moving sideways.
Fast Stochastic: For the Fast Stochastic I use the K period of 20 and D period of 5. These are not default settings, but settings I use for the 1 to 3 month S&P 500 chart when I have it set for daily views. The Fast Stochastic has a down signal in place.
Support Levels To Be Aware Of:
The market has been trying to build support at the 2250 level. There is light support at 2195 but better support is at 2180 and then 2150.
Stock Market Outlook for Tomorrow – Thursday Feb 2 2017
The two small rallies, both on Tuesday and again today have not improved the technical outlook for stocks.
There are 3 sell signals on the S&P. There are 3 weak positive signals two of which are falling. The RSI remains stuck sideways for the time being.
This means there are more bearish signals than positive signals in place.
Investors need more clarity from Washington and an end to the political infighting to sooth frayed investor nerves. Most do not want to sell out, but eventually if the choppiness in trading is strong enough, investors will move more cash to the sidelines resulting in stocks moving lower.
Facebook Stock earnings were terrific and may help the NASDAQ try to stay positive on Thursday but for now the outlook is still choppy with a bias leaning to the downside.
The outlook then is choppy with a slight bias lower for Thursday. A bit of caution remains warranted short-term.
Stay FullyInformed With Email Updates
Market Direction Internal Links
Profiting From Understanding Market Direction (Articles Index)
Understanding Short-Term Signals
Market Direction Portfolio Trades (Members)
Market Direction External Links
IWM ETF Russell 2000 Fund Info
Market Direction SPY ETF 500 Fund Info