
The day started off negative but 3 factors played a role in moving the indexes back higher. The first was a continued decline of the US Dollar which helped to push many commodities higher including the price of oil. Added to the US dollar decline, US Crude inventories dropped from their highest level in 8 decades. (Yes that is correct – 8 decades). This boosted oil which rose 5%. Finally, the biggest push came from Fed minutes which showed that the Fed was concerned how a rate hike in April would be perceived by consumers. In other words, the Fed remains accommodative, at least until the next Fed President speaks out of line, which could be within days. It would be great if the Fed had a consistent policy that all Fed officials had to support. This would make investing a lot easier, wouldn’t it.
S&P Index Close
The S&P closed up 21.49 points to 2066.66 erases much of the losses from the recent weakness in the market.
Dow Jones Index Close
The Dow Jones closed up 112.73 to close at 17,716.05.
NASDAQ Index Close
The NASDAQ closed up 76.78 points to 4920.72.
Stock Market Outlook – Advance Decline Numbers
Volume was light at 3.7 billion shares on Wednesday. 77% of volume moved up with 21% moving lower by the close. There were 121 new highs and just 15 new lows.
The move back higher on Wednesday with new highs is a good signal for the market. Thursday will be pivotal for the market.
Stock Market Outlook – Technical Indicators At The Close
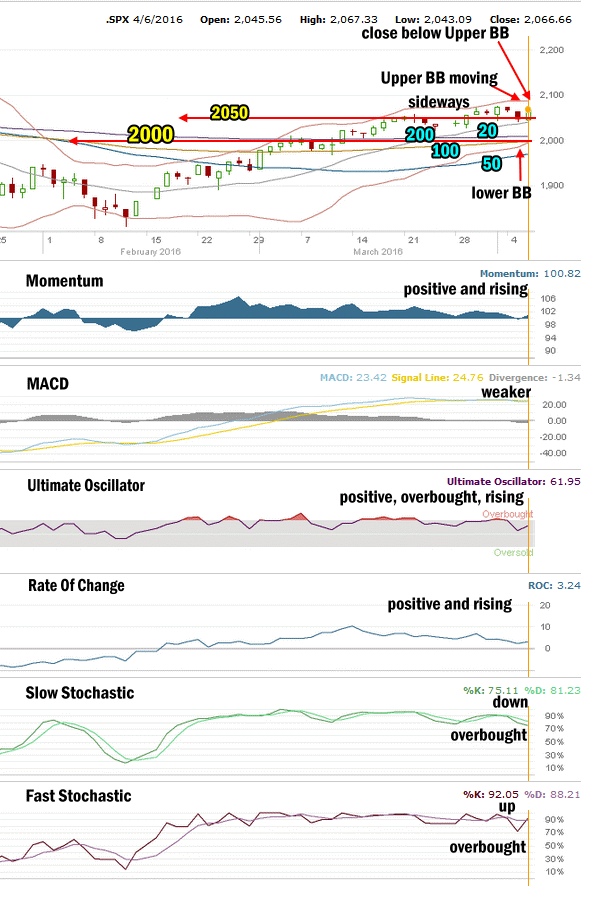
Stock market outlook – Apr 6 2016
Stock Market Outlook: Chart Comments:
The S&P closed above the 200 day moving average but below the Upper Bollinger Band. The Upper Bollinger Band though is now moving sideways while the lower Bollinger Band is moving higher. This could send the S&P into a Bollinger Band Squeeze.
The 20 day simple moving average (SMA) is still rising higher after crossing above the 200 day exponential moving average (EMA).
The 50 day moving average is continuing to turn up and as you can see in the chart the 100 day is also now turning higher and by the end of the week or next week it could cross up and above the 200 day. This would be a major buy signal if it happens.
The 200 day is still leading the market followed by the 100 day and we should stay aware of that indication, as medium-term it remains a bearish sign. The chart pattern no longer suggests the market will move higher. Today’s closing candlestick is often bearish for the following day.
Stock Market Outlook: Support and Resistance Levels:
These are the present support and resistance levels. These levels have not changed since January 2015.
2100 is resistance.
2075 was light support and is now resistance. Below that is 2050 which is now light support.
Better support is at 2000.
Weak support is at 1970 while stronger support is at 1956 and technically it is more important than 1970 for the market. 1940 is light support as is 1920. 1900 is more symbolic than anything else.
1870 is support. 1840 continues to be support. The 1820 level is light support. The strongest support level is at 1800.
1775 and 1750 are both critical support for the present bull market. While 1775 is important it is 1750 that is the bottom line.
A break of 1750 would mark a severe correction from the all-time high of 2134.72. This would be the biggest correction since the plunge in 2011 of a 20% pullback. A pullback to 1750 from the all-time high would be a drop of 384 points for a decline of 18%. A pull-back of that size would definitely stun investors and bring to question whether the bull market which started in 2009 is finished. From 1750 it is an easy slide to 1600 which was near the market top in 2007.
Stock Market Outlook Technical Signals
Momentum: For momentum I use a 10 period when studying market direction. Momentum is positive and climbing.
MACD Histogram: For MACD Histogram, I am using the Fast Points set at 13, Slow Points at 26 and Smoothing at 9. MACD (Moving Averages Convergence / Divergence) issued a sell signal on April 5 which was confirmed today.
Ultimate Oscillator: The Ultimate Oscillator settings are: Period 1 is 5, Period 2 is 10, Period 3 is 15, Factor 1 is 4, Factor 2 is 2 and Factor 3 is 1. These are not the default settings but are the settings I use with the S&P 500 chart set for 1 to 3 months. The Ultimate Oscillator is positive and back climbing.
Rate of Change: Rate Of Change is set for a 21 period. The rate of change signal is positive and also moving higher.
Slow Stochastic: For the Slow Stochastic I use the K period of 14 and D period of 3. The Slow Stochastic tries to predict the market direction further out than just one day. The Slow Stochastic is signaling down for stocks and is overbought.
Fast Stochastic: For the Fast Stochastic I use the K period of 20 and D period of 5. These are not default settings but settings I set for the 1 to 3 month S&P 500 chart when it is set for daily. The Fast Stochastic is signaling up for stocks and is overbought.
Stock Market Outlook for Tomorrow – Thursday Apr 7 2016
The technical indicators are now split with 2 sell signals and 4 positive signals including an up signal from the Fast Stochastic.
The rally on the basics we saw on Wednesday may have enough energy for another rise on Thursday but not much has actually changed. Today’s move looked more like a rebound rally on light volume. The final hour of trading was juiced higher by computer programmed trading.
For thursday look for the day to open lower and then try to climb back toward the 2073 level. A rejection of that rally will mark a further pullback once again and a negative close.
My own outlook is for stocks to eventually reach at least 2080 but whereas they might do that, any hint of bad quarterly earnings will send stocks back down.
Stay cautious on Thursday and watch for signs that the market can hold the 2060 valuation. If the S&P dips back below 2060, it will signal that Wednesday’s rally was just an overbought bounce.
Right now Thursday looks like it will try to push higher but fail. Whether it closes negative is tough to predict but I would not expect the market to move any higher than 2073 but it could easily fall below 2060.
This means Thursday’s market is mixed.
Stay FullyInformed With Email Updates
Market Direction Internal Links
Profiting From Understanding Market Direction (Articles Index)
Understanding Short-Term Signals
Market Direction Portfolio Trades (Members)
Market Direction External Links
IWM ETF Russell 2000 Fund Info
Market Direction SPY ETF 500 Fund Info