Nucor Stock continues to provide exceptional returns. Nucor Stock symbol is NUE. Part of the reason for this is the sheer volatility in the stock itself. Nucor Stock has been volatile for almost a decade now and since the bear market of 08 – 09, volatility has only increased. On average the volatility has been over 30% over a 20 day period. This changed recently when Nucor Stock commenced a climb in mid-December of last year. Moving from the $38 to $40 range up to the $44 to $48 range has seen volatility pull back. Often the volatility has fallen below 30% and indeed presently it can fluctuate between 22% to 28%. The trick is to pick the bottom of the present trading range and keep Put Selling every time the stock dips back. Let’s take a look.
Put Selling Range for Nucor Stock Sept to March
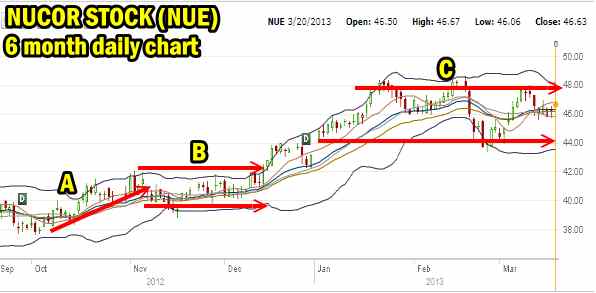
In the 6 month daily chart below I have marked the key aspects.
A. The rise in October from $38 to $40 took the stock into early November.
B. For November and December the stock returned to a previous range which was a low of $38.50 to a high of around $41. This made Put Selling at the $39 strike simple and highly profitable.
C. Following the range at point B, investors felt that if the economy was improving that Nucor earnings would improve. They commenced buying in mid to late December and pushed Nucor stock to a new 52 week high setting an unproven range between about $44.25 to $48. This has made the $43 profitable and worth put selling but above that strike is questionable despite the large put premiums.

Put Selling Range for Nucor Stock Sep 2012 to Mar 2013 daily chart
Put Selling Rescue Strategy
A couple of things have warned investors that this range at point C may not last and could end up seeing shares assigned if the Put Selling takes place above $43. First is Nucor stock itself is unproven at this level. Point B on the stock had a proven track record and very good support so when the stock pulled back below $38 in September and October it was easy to jump in and buy stock because I believed it was trading below solid support. This worked out very well and the profit was excellent as the stock climbed back. But point C has little track record yet.
The second problem can be seen in late February in the chart above. Nucor Stock fell off when management indicated they did not see the recovery within their earnings that “everyone was talking about” per management’s remarks. This pushed the stock down to just below $44 which as you can see in the chart was the start point of the rally in early January right after the December dividend payout.
So on one hand Nucor Stock management are not expecting earnings to improve any time soon but investors have pushed up the stock anticipating better earnings if indeed the US recovery is gaining momentum. Put Selling a new range is always tricky because the range could easily be a “fake-out” and investors end up Put Selling an unproven range which collapses back to a pre-existing range where there is support.
To that end I need a rescue strategy for that “just in case” scenario. The obvious and easiest would entail 3 parts.
1) Sell in the money covered calls if assigned.
2) Sell additional puts if the stock falls lower to average down any assigned shares.
3) Consider buying shares if the stock falls through support at $38 to $36.
Put Selling Against Longer-Term Support
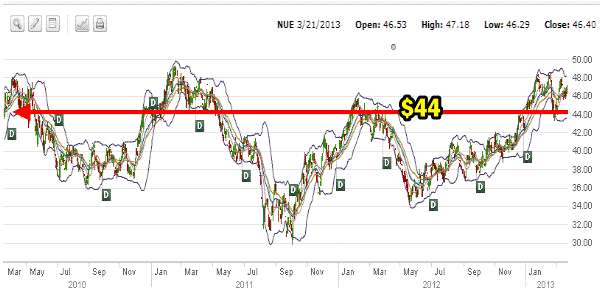
One thing that can often help when deciding on Put Selling strikes is going back more than a year. For example below is the Nucor Stock chart for the past 3 years. Looking back in time without even considering adding any technical indicator we can see that Nucor Stock has had trouble holding higher levels. In other words, while today we may think that Nucor Stock looks stronger and indeed perhaps the economy is improving and perhaps Nucor Stock is finally going to rise and stay above $44.00, but the history of the stock shows us that Nucor Stock has been this high before and been unable to stay here.

Nucor Stock 3 Year Daily Chart
This tells us to be careful. If you look at the declines within the stock over the past 3 years, the downturn has been swift. There would not be a lot of time to buy back and roll down without taking a loss.
Nucor Stock 3 Year Chart – Second Glance
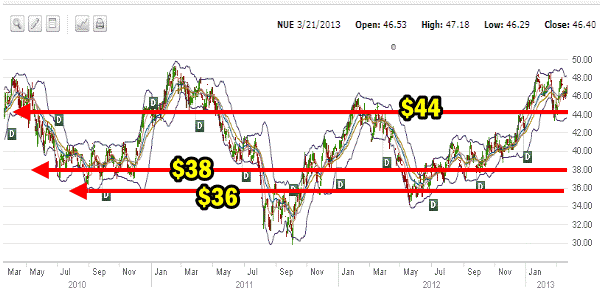
Let’s take another quick glance at the 3 year chart and see what else we can spot.
The same three-year chart without any technical indicators being used can quickly tell us that $38 has a lot of support. Not only is $38 is good level to consider for Put Selling in any pullback, but even if Nucor Stock should fall below $38, the chance of it recovering back to $38 is very good. This means if I was to sell puts on Nucor Stock at $38 and the stock plunged lower, I would roll out but stay at the same strike, namely $38 since the stock has a very good track record of recovering to $38. Eventually my puts would end up out of the money.
One other thing this chart shows us. If the stock falls below $36, it is undervalued and I can either buy calls, buy stock or sell in the money puts at $36 and wait for the stock to recover.

This second chart of Nucor Stock for the past 3 years shows us some support levels to consider.
Put Selling Using A Watch List
I keep a watch list of all those stocks that interest me. From that list I keep stock charts just like above. This watch list can then be placed into alerts on my discount brokers software to send me emails and text messages when certain levels are hit.
For those of us interesting in Put Selling against stocks, the above chart is excellent as I now know what levels to place alerts at in my discount brokerage program. This way when Nucor Stock falls to $39, I will get an alert and start Put Selling the $38. When it falls below $38 I can get another alert and be reminded to roll out any naked puts I sold at the $38 level once they are in the money to avoid being assigned stock. I then set an alert to remind when the stock recovers to $38 so I can close my $38 strike naked puts.
Finally I can set an alert for $37.00 so that if ever this stock plunges below $37 I can get busy Put Selling the $36 strike, buy calls for a bounce back or even consider buying some stock.
Put Selling Nucor Stock Summary
Put Selling Nucor Stock is easy if I take the time to glance at the charts and study the patterns. I know now what strikes to consider for Put Selling and which ones to avoid. I also know when to jump in as soon as Nucor Stock becomes undervalued. All of this makes Put Selling Nucor Stock a simple strategy that requires little time but provides enormous profits year after year.

