Put selling against equities to earn the best option premiums is often a guessing game. I use market timing technical indicators like the slow and fast stochastic, ultimate oscillator, MACD, rate of change and others trying to time the optimum moment to engage in put selling. It is annoying to say the least when puts I have sold for perhaps .50 cents are suddenly .80 cents a day later and then $1.25 two days later. I learned over years of put selling that the best way to get good put option premiums was by using market timing indicators to try to pick the bottom in a down move, and to sell small groups of put contracts just in case the move down had further to go. My recent Johnson and Johnson stock put selling is a good example of using this strategy.
Put Selling For Best Premiums Strategy
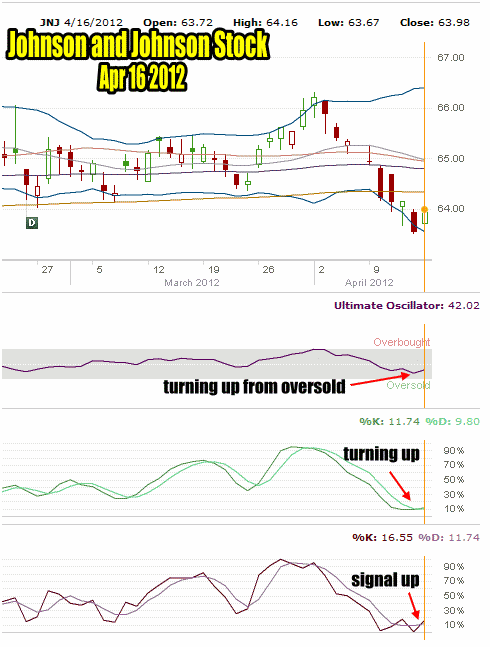
Going back to April 16 2012 Johnson and Johnson stock had sold down to below $64.00 and you can see in the Johnson and Johnson stock chart for April 16 below that the Ultimate Oscillator is starting to move back up from being oversold and the slow and fast stochastic indicators are turning back up. Indeed the Fast Stochastic has given a solid up signal and the %K has turned up and over the %D.

Put Selling Johnson and Johnson Stock Chart For Apr 16 2012 shows market timing indicators all point to the stock recovering.
I know in advance how much capital I am willing to risk on a trade and use for put selling. For this Johnson and Johnson stock put selling I want to sell 25 put options contracts. On April 16 I started with just 10 options contracts or slightly less than half the number I want to sell.
If I am wrong and Johnson and Johnson stock moves lower I still have 15 additional put options contracts to use and I will earn more income, put selling at lower values if JNJ Stock falls lower.
On April 16 2012 then I sold 10 Naked Puts Johnson and Johnson stock for April expiry at .29 cents.
Put Selling When You Have Less Capital
An investor with less capital to commit to put selling Johnson and Johnson stock would simply reduce the number of put options appropriately. For example, if an investor had only $60,000 in capital and margin available that he is willing to risk on put selling the stock, he would look at his strikes and determines the number of put options contracts to sell. Perhaps something like this would work:
Capital and Margin Available = $60,000.00
Strike being considered = $62.50
$60,000 / $62.50 = 960 shares so the investor can sell 9 put options contracts
Break the put selling contracts then into three groups of 3 naked put options contracts each.
Johnson and Johnson Stock Continues Lower
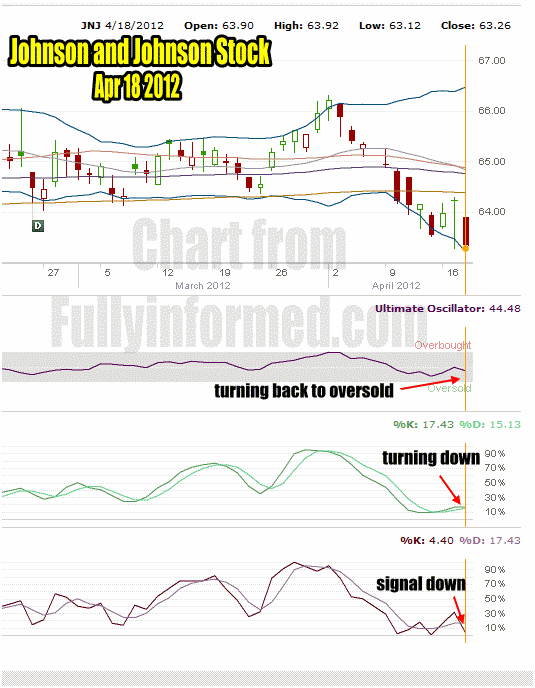
The day after my first put selling, April 17, JNJ Stock recovered, but on April 18 the stock fell lower. My market timing technical indicators that had got me into put selling back on April 16, now show that the stock is moving lower and the fast stochastic is flashing a sell signal.
On this day near the lows for the day I sold 5 more naked puts. The second put selling group was out to May at the $62.50 put strike for .60 cents. I had now sold 15 naked puts which left me with 10 more put options contracts to place.
It is important to realize that while the market timing technical indicators can be wrong, they are showing that I am selling puts in oversold conditions which should give me the best chance of being right and having Johnson and Johnson stock recover before options expiry. As well I am also still selling out of the money naked puts which gives me some room should I be wrong and JNJ Stock continues to fall further.

Put Selling Johnson and Johnson Stock Chart for April 18 2012 now shows market timing technical indicators as signalling stock down.
For readers wondering why the second put selling group were not done for April $62.50 after the first ones were sold for April, it is because option premiums were too low by April 18 to make it worthwhile to risk my capital. By April 18 there was only 2 days left to Friday and options expiry.
Put Selling Third Group On Johnson and Johnson Stock
The next day April 19 2012, Johnson and Johnson stock moved lower again but there were by now enough signs from my market timing indicators that gave me confidence that the low in the stock was set and I could sell my final batch of put options. As well I was confident that the next day, Friday Apr 20 2012 when options would expire, my April $62.50 naked puts would expire worthless. This would immediately free up 10 naked puts at $62.50 for a capital release of $62,500.00.
I saw no reason to be concerned. If Johnson and Johnson stock were to continue lower in the following week, I would have 10 put options contracts available again for more put selling in the days ahead.
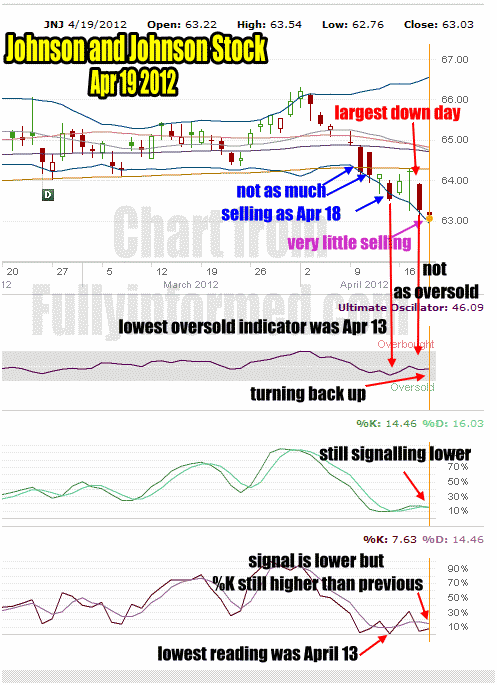
The Johnson and Johnson Stock chart for April 19 2012 below shows all the signals I saw that told me the selling was probably over or at least there was a limited chance JNJ Stock would move much lower. This told me to go back to put selling and use all my remaining put options contracts.

Put Selling Johnson and Johnson stock chart for April 19 2012 shows that the market timing technical indicators are all in agreement that the worst selling was back on April 13 and JNJ stock has limited chance at present for falling further.
Put Selling And The Technical Indicators To Watch
In the Johnson and Johnson stock chart above you can see the signals I am referring to. On April 10 when selling really started on JNJ Stock, there were three solid down days. April 13 though saw limited selling, yet it pushed the ultimate oscillator and fast stochastic to the lowest readings deep into oversold territory on Johnson and Johnson stock.
After April 13 the stock did continue lower but the selling pressure was not as great. This means there are fewer and fewer sellers which will slow the decline in the stock. On April 13 JNJ stock closed at $63.54 and by April 19 Johnson and Johnson stock had set an intra-day low of $62.76. This represented an additional 1.2% decline in Johnson and Johnson stock.
You would think that an extra 1.2% drop in the stock would have pushed all the technical indicators LOWER than the readings of April 13. It didn’t. In fact on April 18 which was the largest down day in the stock, all the technical indicators still were not as low as the April 13 reading. This is usually a good indicator that the selling is overdone on the stock and it is about to break back up or at the worst trend sideways for a while.
A stock like Johnson and Johnson stock rarely has big falls after it has already moved into oversold valuations. This is a highly regarded stock held by large institutional investors, pension fund managers and retail investors. The chance to pick up shares in JNJ Stock at this level would attract enough buyers to slow the decline and indeed you can tell from the technicals above that after April 13 buyers were in Johnson and Johnson stock picking up shares daily.
I started put selling JNJ Stock on April 16, but I know from experience that rarely when a stock moves lower, is it a one day event. Therefore by April 19 when I sold the May $62.50 naked puts I received .95 cents. That was a full 58% increase in put premiums for a single day and demonstrates the advantage of selling put option contracts in groups.
Put Selling And Patience
The importance of having patience when put selling should not be understated. The above put selling trades on Johnson and Johnson stock show how this strategy produces solid profits.
It should also be mentioned that all the above put selling trades were done on a stock that I would own if assigned. Because of this I started put selling Johnson and Johnson stock as it fell.
If my goal was to never be assigned I would not have done any put selling on Johnson and Johnson stock until at least April 19 and probably I would have waited until April 20th when the stock jumped on good volume which confirmed what the market timing technical indicators were signalling on April 19.
Read More Put Selling Strategies
Read More Johnson and Johnson Stock Articles

