PepsiCo Stock has been volatile since the start of 2012 and with the downgrade back in mid February by analysts to underperform, PepsiCo Stock has continued to fall back to support and then bounced back to resistance. This constant yo-yo of the stock is excellent for returns as on the fall to support I buy stock and sell puts at support and when PepsiCo Stock runs back up to resistance, I sell my stock and if the premiums are low enough I buy to close my puts. I then wait for the cycle to repeat in PepsiCo Stock.
This volatility will not last forever but until investors tire of the whipsawing in PepsiCo Stock, it is definitely adding to my profits. It is important to take advantage of a trading range when it develops such as in the case of PepsiCo Stock. To do this successfully though, means knowing where support and resistance are within the tight trading range that develops otherwise an investor will have to contend with being whipsawed.
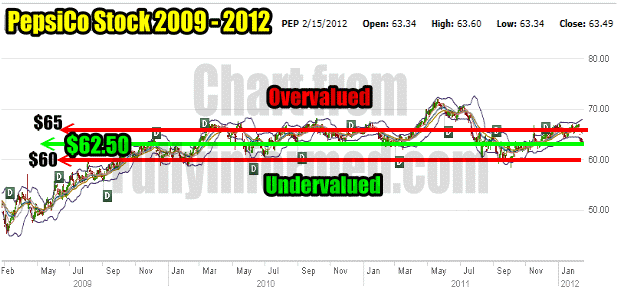
Through using my support and resistance tools which I discussed recently in a number of articles, I had pinpointed support at $62.50 and resistance at $65.00. This is a tight range and so far it has held making put selling and stock trading simple and easy.
All the PepsiCo Stock trades for the year can be found here. In my PepsiCo Stock article of Feb 15 2012 I indicated where I felt support and resistance in the stock was currently. I included in that article the stock chart below.
PepsiCo Stock 3 Month Chart
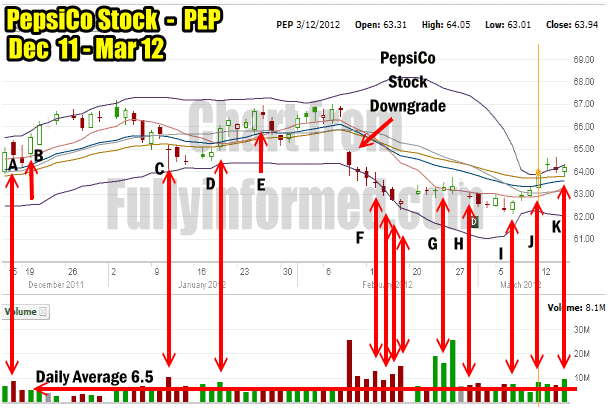
Using Volume to pick support and resistance levels in a stock is a fairly straight forward approach. You can read further about support and resistance in these articles. The 3 month PepsiCo Stock chart below shows how I have used volume to assist in my put selling and stock trading of PepsiCo Stock over the last 3 months. I have marked the events from A to K and then described each in the paragraphs below the chart.

PepsiCo Stock Dec 2011 to Mar 2012 Showing Trades Done
PEPSICO STOCK CHART TRADE INDEX
A – Dec 16 2011. PepsiCo Stock volume was 8.6 million shares. I was ready for the stock to fall further.
B – But on the Monday Dec 19 the volume fell back to just 4.9 million shares. The stock fell easily to $64.20 before closing at $64.37. Part of the reason for the low volume was the Christmas period. I sold naked puts for Feb at the $60 strike.
C – On January 11 2012 volume climbed to 10.5 million shares and I was prepared for the stock to fall further. However the next two trading sessions the volume in PepsiCo Stock stayed average and the stock drifted lower.
D – On January 17 volume moved to 7.5 million and the stock appeared to have bottom at about $64.50. I bought shares.
E – On January 26 volume was only 5.1 million but the stock moved up well and I sold my shares.
F – On Feb 9 PepsiCo Stock tumbled on the underperformance analysis and report and 25.6 million shares traded. I waited for volume to start to fall back and for the stock to slow its decent. I felt from looking at the previous charts as explained in my earlier PepsiCo Stock Articles, that there was enough support at $62.50 to hold the stock there. I started selling puts on Feb 14 and buying stock. I continued to sell puts each day until Feb 17. In the end I picked up 3500 PepsiCo Stock and I used margin to sell puts at the $60 strike as well as the $62.50 puts with my capital. I increased the amount of capital committed to PepsiCo Stock since I had quite a bit of capital still not in use after Feb options expiration.
G – On Feb 23 volume was 19 million shares but the stock moved just from a low of $62.83 to $63.24 and closed at $63.13, a tight range. The following day Feb 24 volume was 16.1 million shares and the stock closed at $63.31 up just slightly from the previous day. I sold my 3500 PepsiCo Stock shares. I felt that unless volume could pick up and push the stock, there could be another downturn in the works and this move up might be just a bounce. For that reason alone, I sold my shares.
The following day, Feb 27 PepsiCo Stock volume was 25.50 million shares but the stock managed to reach a high of just $63.75 and closed down to $63.32. It was obvious to me that PepsiCo Stock was facing resistance at $64.00 and I figured it would probably fall back to support around $62.50 before trying to push back up.
H – I am showing this day Feb 29 because it was a pivotal day for PepsiCo Stock as volume was just 7 million and the stock closed almost where it opened at $62.94. With such a small move from open to close it is normally a sign that the stock will move lower before trying to rally again.
I – That is exactly what happened to PepsiCo Stock as it fell back to $62.22 by March 6 on 7.7 million shares. Since it was again back at resistance ($62.50) I bought stock and sold puts. Most of the days when PepsiCo Stock pulled back starting Feb 29 volume tended to be average or slightly above average. With that type of volume it would be difficult for the stock to rise. Again the stock fell to support and then volume picked back up on March 7 at 7.5 million shares. The stock hit a low of $62.15 but rose and closed at $62.62 which is again just above the value I picked for support, namely $62.50. Closing back above support is a good sign that the stock would climb from here.
J – March 12 and volume picked up to 8.1 million shares. PepsiCo Stock traded from a low of $63.01 to $64.05 and then pulled back to close at $63.94. I felt when the stock pushed to $64.00 that it was back into resistance so I sold my PepsiCo Stock again.
K – I marked March 15 as K (today) to show that, the day after I sold my shares (Mar 13), PepsiCo stock pushed higher, up to $64.57 but on volume of 7.4 million, slightly less than the previous day. The next day the stock fell back. Today however volume was 9.5 million which is higher than the past 3 days. The stock however closed at $64.17 just slightly higher than yesterday’s close of $64.06. The increased volume could be traders unloading positions, disappointed that PepsiCo Stock has not broken back up to $65, which I marked in my PepsiCo articles as resistance. As well PepsiCo Stock had a low of $63.80 and a high of $63.34, but failed to hold at $63.34. Again this could be a sign that the stock is poised to pull back once again.
PepsiCo Stock Trade Conclusion
With Friday’s options expiry I see no reason to expect I will be assigned on any of the naked puts I am holding at the $62.50 strike on PepsiCo Stock. By following volume and looking for those periods when volume is above average, I have been able to use those periods to watch for opportunities to both buy stock and sell puts and then on any rise, watch for resistance to blunt the volume and allow me to sell my stock and buy to close sold puts.
I cannot estimate how long this trading range can continue, but in the current bull market PepsiCo Stock might pull back to $63.00 and then move higher. But if the bull market should correct, then PepsiCo Stock could fall below $62.50 and try to test support at $60.00. My own personal guess is that PepsiCo Stock will move somewhat higher but then pull back again allowing me to repeat my strategy. At least that is what I hope as PepsiCo Stock has been good for my portfolio.


