Selling Out Of The Money Options
Part 1 – The Strategy Explained and The Rules
In bear markets I enjoy selling out of the money options. With declines of 500 points in the Dow Jones Index, investors are fleeing to the safety of treasuries and bonds. However they provide little yield and they too are not without risk.
Buying bonds when stocks tumble means paying more for the bond that it is actually worth and settling for yields that are often 2% or less. I cannot imagine tying up my capital for a 2% return. Inflation alone will eat up any return and some of my capital.
The problem is stocks are scary when the bear market growls. As investors know from the bear market of 2000 to 2003 and 2008 to 2009, stocks can collapse further than many investors dared imagine. However I have sold out of the money options throughout the bear markets I previously mentioned which easily returned 6% and better in a year while reducing risk of stock ownership.
Selling Out Of The Money Options – My Strategy Explained
Sometimes bear markets can last a number of years. For example the bear market of 2000 to 2003 eventually saw almost a 50% decline in the overall S&P 500. However many stocks fell further than the overall index. Throughout this bear market I sold out of the money options.
I select dividend paying large cap multinationals and then sell far out of the money options during bear markets. I sell far out of the money puts as well as calls.
But it is not just a matter of, pick the right stock and sell out of the money options. There are a number of steps. To better understand how I apply my strategy of selling out of the money options, I will look at Johnson and Johnson stock in the 2008 to 2009 bear market. Johnson and Johnson’s stock symbol is JNJ.
Throughout the example I will present a number of rules that I developed and which I apply to this strategy .
RULE 1: Examine the stock in the previous bear market. How did the stock perform. If the stock lost more than 50% of its value, then I do not select that stock for selling puts , but it could be a good candidate for selling naked calls.
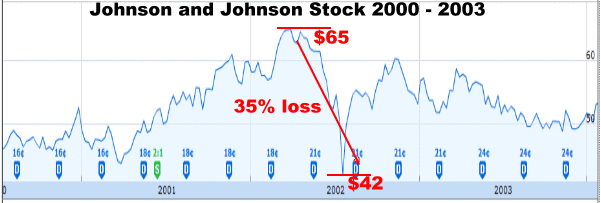
Below is the Johnson and Johnson stock chart for the 2000 to 2003 bear market. I have rounded up the actual stock prices for both the high and low. I can see that the stock lost 35% of its value from the high during this period to the low.
It is interesting to note how $65.00 which JNJ stock reached recently does mark the higher range for the stock this year (2011). This just goes to show how much stocks move around, and how often they actually do not go anywhere over long periods of time which is another great reason to sell out of the money options against specific stocks.
The chart below shows me that this stock while losing 35% of its value, still managed to not collapse as far as the overall market did. This is a good stock for my selling naked puts strategy. It is also important to note that the move from $65 to $42, did not occur overnight, but happend from March to July 2002, a period of 6 months. Again this is excellent for my selling naked puts strategy.
Out Of The Money Options – The Bear Market of 2008 to 2009
During bear markets normally volatility increases which makes selling out of the money options realistic and profitable. When the VIX Index which measures volatility in the stock market falls below 20, out of the money options have lower premiums. However when the VIX rises to 30 and above, out of the money options premiums rise dramatically, making selling out of the money options very beneficial and worthwhile.
RULE 2: Only Sell Put Options Against Stocks You Would Own
When selling puts in a bear market, the chance of assignment is high. This meams I want to sell out of the money put options ONLY against stocks that I would own if I was assigned. There is no point is selling put options against stocks that I do not want to own in any market, but in a bear market it can be a disaster. By selling a put option for .50 or .60 cents and then having to buy it back should the stock fall placing my out of the money put option, into the money, makes for a very unprofitable trade. In a bear market when a stock falls the put that I sold for .50 cents can easily cost me $3.00 or more to buy back. Do enough of these trades and they can severely damage any portfolio.
RULE 3: Only Sell Naked Call Options On Stocks The Are Clearly In A Downtrend
Selling out of the money call options on stocks is different than selling out of the money put options. Selling out of the money call options can turn nasty if the stock I pick is actually just bouncing lower before it returns to an uptrend.
To assist I look at the long term trend in the stock usually back 6 months to a year. I then plot the 50 day, 100 day and 200 day moving averages. It does not matter whether they are the simple or exponential moving averages.
Out Of The Money Options – Priceline Stock
For example look at the Priceline chart below. Pricelink stock has been a bellwether of this market. Look at how the 50 day, 100 day and 200 day NEVER crossed over each other.
This stock is in an uptrend. Despite the bearish tendencies of the market, any downturn in this stock MUST NOT BE SOLD AGAINST until the 50 and 100 day moving averages have crossed the 200 day signalling that the stock is in trouble and could possibly fall lower. To review the last 3 years of priceline stock you can select this link dealing with out of the money options. The climb in value directly related to the bear market recovery is evident. Selling out of the money options against Priceline Stock makes a lot of sense based on the chart.
There are far too many stocks to sell naked calls against to be concerned with those stocks that exhibit strong uptrends even in a bear market. Remember that even in bear markets, stocks can and will move up. Often they will move up more violently than in a bull market which can suddenly place out of the money call options, in the money.
Out Of The Money Options – Nucor Stock
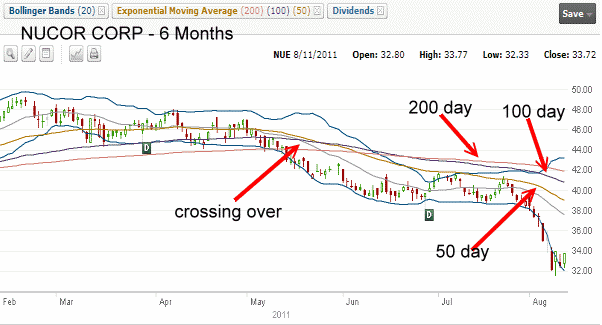
Below is Nucor Corporation Stock – Stock symbol is NUE. This is a 6 month chart. The crossing of the moving indicies is clearly marked. This stock is in definite trouble and would make selling out of the money options in naked calls a better alternative to naked puts. The 50 day and 100 day are all moving lower leaving the 200 day behind. The chance of a quick recovery is limited and with volatility high, the naked calls have enough premium to make selling them worthwhile.
To view a 3 year chart of Nucor Stock you can select this out of the money options link. The failure of Nucor Stock to recover from the 2008-09 bear market collapse is obvious.
RULE 4: Out Of The Money Options – DON’T GET GREEDY
My 4th rule is to not get greedy when selling out of the money options. Once out of the money options have been sold I take any opportunity to close them for 75% of the value I received. In other words if I sold the option for $1.00 and it reaches .25 cents, I buy to close the option immediately. It’s a bear market and I know that rallies and collapses can be quick and severe.
I want to lock in my profit as soon as it reaches my guideline. I have seen many trades that were profitable suddenly turn against me within a day in bear markets.
Selling Out Of The Money Options – Summary Part 1
In the next article I look at my Johnson and Johnson stock trades from 2008 to 2009 to review selling out of the money options against a great stock.


