Options expiry for the month of October 2011 was among the best Octobers I have had in many years. Excluding the exceptional October 2008 options expiry when option premiums went through the roof thanks to the bear market collapse that month, this October saw some excellent option premiums earned.
Options expiry for October tend to be good as many Octobers have seen higher volatility. Overall though, Septembers tend to have better volatility than October.
I had sold many options for October expiry because of the higher volatility which pushed premiums up and was 100% invested for this month’s options expiry.
Options Expiry October Results
AT&T Stock (T Stock) – I had sold 20 October $26 naked puts. All expired. – Total Income = $761.00
CLOROX Stock (CLX Stock) – I had sold 5 Oct $67.50 naked puts and 5 Oct $57.50 puts. All expired – Total Income = $1418.50
Coca Cola Stock (KO Stock) – This is an interesting trade. My 8 naked puts for Oct $62.50 expired. Total income = $690.75
I am still holding 2 Naked Puts for Jan $55 put strike which I sold in November 2010 for $2.81. This has been a fantastic trade. The share basis of KO Stock is now at zero.
Exxon Mobile Stock (XOM Stock) – The recent roll down I did in XOM Stock was unnecessary as the stock closed at $80.13. I had sold 5 Oct $60 naked puts and 5 Oct $55 naked puts, all of which expired. Total income = $743.50
Intel Stock (INTC Stock) – I had sold 5 Oct $16 naked puts which expired. Total Income = $86.75
Johnson and Johnson Stock (JNJ Stock) – This is an interesting trade. I had sold 2 Oct $62.50 naked puts and 5 Oct $57.50 puts all of which expired. Total income = $1207.25. The 2 Oct $62.50 naked puts were sold back in April 2011 when JNJ Stock was at $60.56. I sold the puts for $4.15. This shows the value of staying with large cap dividend paying stocks that have defined tradable ranges. I have discussed this many times in various articles. I am still holding 2 Jan $60 naked puts which I sold back in December 2010 and 2 Jan $65 naked puts. JNJ Stock continues to be an excellent investment.
Kraft Stock (KFT Stock) – This is the trade that continues to cost me nothing. I have made enough on Kraft by mid last year that no matter when I am assigned the stock is paid for by capital earned from selling puts. I has sold 5 Oct $32 puts and they expired. Total Income = $276.75
Merck Stock (MRK Stock) – I had sold 5 Oct $29 naked puts which expired. Total Income = $236.75
Microsoft Stock (MSFT Stock) – I had sold 10 Oct $22 naked puts which expired. Total Income = $290.50
I am still holding 6 naked puts for Jan at the $26 strike. I have made enough with my Microsoft trade to pay for the 600 shares if assigned.
Nucor Stock (NUE Stock) – Another interesting trade. I am holding shares which I took assignment on in August. I have picked up the dividend on those shares as was my plan and I am still holding in the money covered calls on Nucor Stock. The stock closed at $36.80 on Friday and my 5 Oct $25 naked puts expired. Total income = $323.00 with the dividend. I am still holding deep in the money covered calls and 5 January $35 naked puts which I plan on rolling as January approaches.
PepsiCo Stock (PEP Stock) – Yet another great trade. As some of you may recall in August I accepted assignment on 500 shares to gain the dividend and sell an in the money call at the Oct $57.50 strike. On Friday the stock closed at $62.28. There was not enough premium left in my in the money covered call unless I wanted to roll out to April 2012, which still would have only netted about .60 cents after commission. I let the stock be exercised. 5 Covered Calls exercised at $57.50 and 5 Oct $60 naked puts, 5 Oct $55 naked puts expired. Total Income with dividend = $654.25
Overall the covered call trade on PepsiCo stock made $311.00 or about 1% for 2 months.
Visa Stock (V Stock) – I had sold 15 naked puts $70 and all expired. Total Income = $1002.25
YUM Stock (YUM) – This is an interest trade as back on Sep 29 the stock collapsed 7% in the day. I wrote an article looking at the steps I take to decide whether the stock is in a decline and should no longer be traded. Good thing I have those tools available as they told me to stay in YUM Stock and my Oct $47 and Oct $45 puts all expired. Total Income = $758.50
Options Expiry – October Total Earnings 1.38%
For the month of October the earning totalled $8449.75. This represents a return of 1.38% for the month.As my goal is 1% I am well within that measure for another month.
Options Expiry – The Advantages Are Numerous For Selling Put Options
There are so many advantages to selling put options. This month was an excellent example as the market volatility continues to keep put premiums high making my job of earning 1% a month for my total capital, a lot easier.
ANNUAL GOAL BEING REALIZED
My goal is a return of 12% for the year on my stock positions, leaving aside my SPY PUT Hedge.
To date income from my trades is $65456.00, for a return of 10.73%.
I have two months left, Nov and Dec to make up the remaining 1.27% to reach my goal.
SPY PUT HEDGE EARNINGS
When my SPY PUT Hedge which has earned $65,020.00 this year, is added in, the total return for the year is at $130,476.00 or 21.4%. I am well protected in the event of a dramatic pullback such as a possible European default.
Options Expiry Advantage – Capital Is At Risk For Short Periods
As well I was 100% invested in my naked put positions using a total of $640,800.00 but as of market close on Friday, I only had $175,447.00 left in the market.
This is one of the great things about selling puts. My capital is at risk for shorter periods of time and allows me to reassess strikes and stocks before committing capital for another short period.
Options Expiry Advantage – Positions Can Be Constantly Reassessed
At $175,447.00 in the market, this represents just 27% of my available capital. A great advantage of options expiry is the ability to reassess my positions and determine if the stock still meets my criteria and the put valuations are worthwhile to sell.
Options Expiry Advantage – Annual and Monthly Goals Are Reviewed and Applied
With my goal of just 1.27% over two months, I only need to earn .635% or $2600.00 each month and I will meet my goal of 12%.
Options Expiry Conclusion for October
I continue to post my trades and these options expiry summaries to show other investors that by establishing realistic goals, assessing stocks that would aid in meeting those goals and then applying the available capital properly to the financial investment strategy of selling puts, an investor can secure a very decent return while having protection from market corrections, severe bear markets and unforeseen events which can be damaging to a portfolio. I hope that through continually writing about my trades, how I apply my strategy to those trades and how I set up realistic goals and objectives, other investors will begin to think about their own investing and consider establishing strategies that meet their levels of risk and styles of investing.
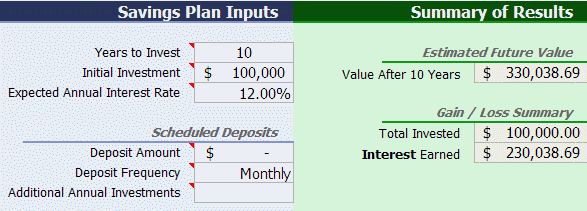
I would like to leave readers with the following charts. The first shows the growth of $100,000 over just 10 years at 12% annual return. The original capital triples in value.
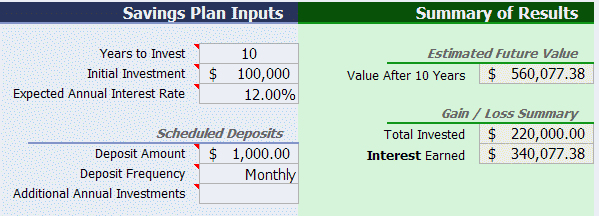
The above chart though is based on the 12% being reinvested annually. While I have no spreadsheet that can calculate out the monthly re-investment of the earnings, let me present this chart and show that by taking $1000 monthly from the earnings and reinvesting it, the results is astounding.

This chart shows $100,000 initial deposit and reinvesting of $1000.00 each month from sold put earnings.
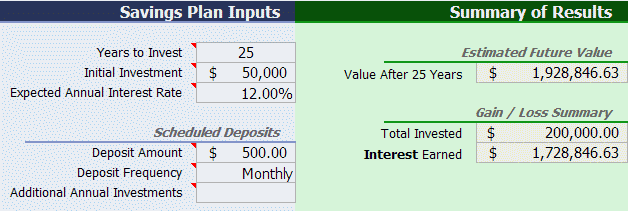
Finally one last chart. For those readers who have less than $100,000.00, here is a chart of $50,000.00 with the earnings of just $500.00 or 1% each month reinvested. Over a 25 year period earnings reach 2 million dollars. This spreadsheet is flawed because it does not take into account that each month the investor has a bit more to re-invest until by the 5th year the re-invested monthly amounts are larger than $500.00. Remember too that in all these charts, the investor started with one lump sum and never added new capital other than earned capital from selling puts.

This chart shows $50,000.00 invested with monthly earnings of $500.00 reinvested over a period of 25 years.
Options Expiry – Final Word From The Author Of FullyInformed.com
I must indicate that I am a bit older and I have invested for more than 35 years. The work to maintain the fullyinformed.com website and put up trades and explain how I approach stocks is far more than I had thought. I plan to continue but often I will be late at getting up options expiry results and some months I will probably miss altogether. There are so many strategies to present and discuss and I know from emails that readers are waiting for “Part 2” of this and that, and how about that Ultimate Oscillator paper or for my fellow Canadians my RRSP trades.
I hope to get to everything, but at my age between family, friends, my own investing and my free time, which is why I saved and invested all these years to enjoy my retirement, there is only so much time available for fullyinformed.com.
I have learned a lot about a website and I have so many people to thank for their help and their support.
I hope readers don’t lose sight of the goal of fullyinformed.com. I built my site to try to say to investors that there is no need to chase the latest Netflix (which has plummeted), RIMM (which too has collapsed) or Amazon which trades at a PE of 74X yet has a book value of just $17.00. Instead through a careful well constructed plan and through studying stocks and their history as well as remaining aware of their future potential, an investor can develop a strategy of small monthly successes that over a time will build to provide a wonderful portfolio.
This is and remains my goal. I hope readers ponder my articles and consider strategies to formulate their own strategies that suit them best.
Options expiry is always exciting. Each options expiry to me, is just like the very first one I experienced which was on October 19 1973 with just a handful of stocks because there were hardly any stocks with options. I still have my printed ledger from all those years ago.
That evening when options expiry ended I saw a small return in my ledger and saw my capital still intact and I realized, “Hey, maybe there is something to this strategy after all.”
My Best Wishes To My Readers
Teddi


