Microsoft stock is experiencing weakness at this stage of the rally in the stock. I did more put selling this morning on Microsoft Stock although only 5 contracts for April at .27 cents. I do believe there could be further put selling and stock trading opportunity ahead as Microsoft Stock could test for support at this stage of its rally. My market timing technical indicators are reflecting the ongoing weakness in the stock which has had an impressive rally.
For those of you who have watched Microsoft Stock, I think the most important aspect right now is the number of analysts who are bullish on Microsoft Stock. That always concerns me as I prefer put selling stocks that no analyst is interested in.
For example over the past 10 years Microsoft Stock has been labeled everything from a loser to a go nowhere stock. During that time I have earned annual double-digit returns by simply put selling against the trading range that the stock was stuck in. With analysts and “soothsayers” staying clear of Microsoft Stock for over a decade my put selling reaped large rewards.
Now that so many analysts have jumped on board the Microsoft Stock wagon the only nice thing is that they have pushed up volatility making put selling even more profitable, but making the process for picking the proper put selling strike more difficult.
Microsoft Stock Chart For April 3 2012
Looking at today’s Microsoft Stock chart around 12:20 PM (EST) (below) you can see the distinct head and shoulder formation in the stock over the last trading sessions. I don’t believe this is a sign of any huge drop in the stock but it could very easily fall to try to find support levels which I believe are probably around $30.50 to $31.00. I do believe the stock has had a very nice run up, which as you may recall from my March 23 Microsoft Stock Covered Calls article is why I sold the Microsoft Stock May $33 covered call in my retirement account. Simply I felt the run up had been strong and now it was due to test for some strength in the stock before resuming a move higher. I did not want to unload my shares at this point.
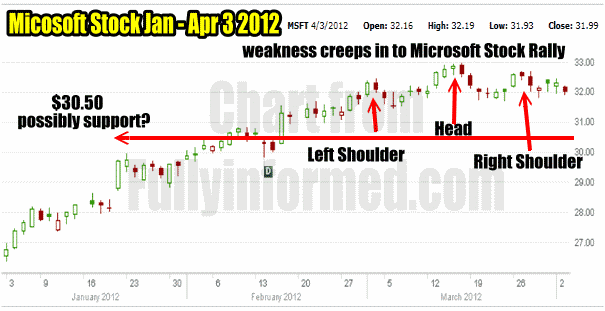
Microsoft stock weakness is clear in this chart. Strong put selling opportunity I believe lies ahead.
Microsoft Stock Waterfall For April 3
Below is an image of this morning’s beautiful waterfall in Microsoft Stock as the stock searches for support. It could easily fall below $31.00 to find where true support lies.
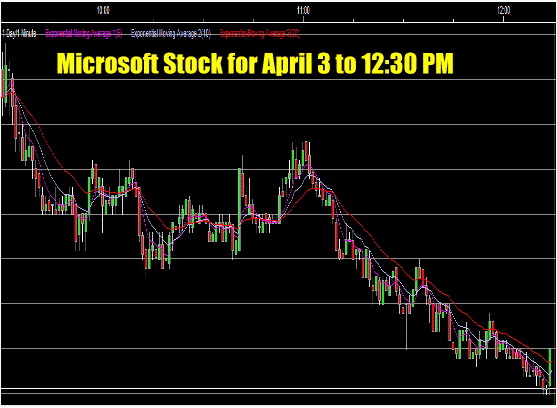
Beautiful waterfall in Microsoft Stock provides a great put selling opportunity
Microsoft Stock Searching For Support
The waterfall for today is common in stocks that have had a great rally and then stall out. Recall that Microsoft stock has not tested for any support zones since the uptrend began. For example I trade at TD Waterhouse here in Canada. I realize that everyone has their favorite discount broker and that’s how it should be. There are many reasons I like TD Waterhouse. I like their active trader platform although there is a lot of room for improvement, but then coming from an age when I did most of my put selling trades by paper and calling a broker, today’s stock trading and put selling world is better, easier and less expensive.
One of the things that comes with TD Waterhouse is their excellent charting and graphing tools along with their own technical insights. I very much enjoy market timing technical analysis as all readers must know by now. TD Waterhouse provides a lot of insight into that area and I enjoy comparing my notes and my own technical insight against what their technical tools are also saying.
Microsoft Stock Support And Resistance
For Microsoft stock the image below from TD Waterhouse shows where their technical tools peg support and resistance levels. Look at how they have picked resistance right near the highs around $32.60 which is obviously a good valuation since the stock has had a lot of trouble punching through there and holding.
However look at where support is pegged. It is at $25.66 which is fully 19.5% BELOW where Microsoft Stock is presently trading. That shows just how powerful this rally in the stock since January has been. For those readers who are stock traders I thought you might be interested in their stop prices for long and short positions.
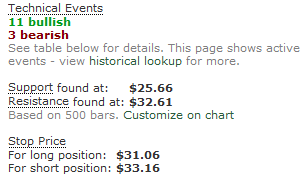
Microsoft stock support and resistance as pegged by TD Waterhouse
Microsoft Stock and Market Timing Technical Analysis Tools
When I looked at my own technical timing tools, which are below, you can see that there is indeed weakness in Microsoft Stock. However the Fast Stochastic market timing tech tool is showing that Microsoft Stock is nearing a bounce. Looking at where Microsoft Stock is now, the fast stochastic, I believe, is indicating that Microsoft stock could fall back to $30.50 to $31.00 before it could reach extremely oversold. That is also where I placed short-term support in the stock.
Whether investors believe it or not, market timing technical tools really do help. The market timing chart below is at 10:35 AM this morning and show BEFORE the waterfall began that the waterfall was probably going to happen. Rate of change warned yesterday that the weakness was building. Momentum though is still flat would could indicate that a bounce will be coming soon unless selling intensifies. Ultimate Oscillator shows that the overbought condition of a couple of weeks back is over. The fast stochastic reading is showing the selling is reaching a possibly bottom soon.
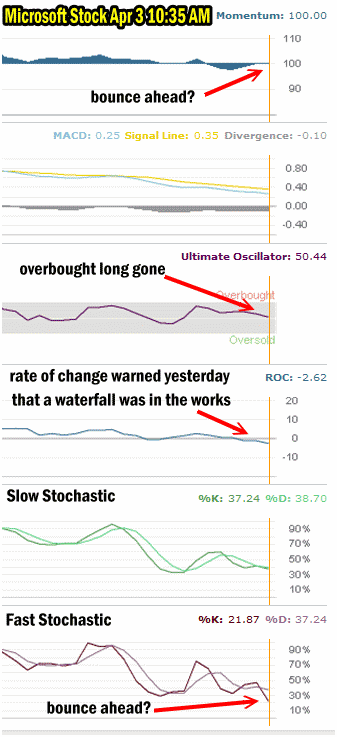
Microsoft Stock Market Timing Technical Analysis shows the weakness
Put Selling Timing Tools
Just to add a little more information to my put selling on Microsoft Stock readers might be interested in these market timing technical readings from my TD Waterhouse account which show the bullish readings versus bearish readings on Microsoft Stock since March. Since the start of March there have been 5 bullish readings and in the last few trading sessions at the end of March, three bearish readings.
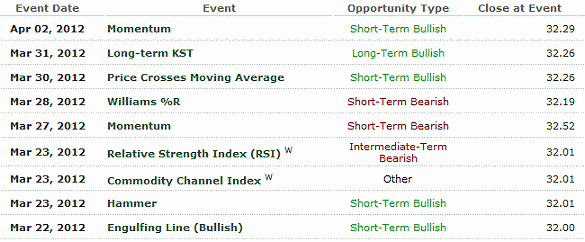
Microsoft stock tech readings on April 3 at Noon
While it is difficult to pinpoint exactly where Microsoft Stock could fall based on the above charts, it is obvious by looking at the period from March 23 to March 28 on the Microsoft Stock chart that the stock itself was stalling and getting ready to test to find where support lies.
Put Selling Opportunities
When a stock pulls back and the market follows as is the case today, many investors become nervous and fail to take those steps to put in place winning trades. Instead many wait for the market or stock to turn back up and then even more investors wait for a day or two to be sure the stock or market is moving up before considering their trades. Then these same investors complain that premiums are too small or the best move is over in the stock.
Consider Put Selling Opportunities
Opportunity abounds in any stock market. It is important to put in place strategies that protect as well as offer reward for the risk an investor is taking. By always waiting for the “best” moment to enter investors will never earn the optimal consistent returns needed to compound their capital. This is why I prefer to stay with solid companies. If for example Microsoft Stock should fall back to $26.00 or $27.00 dollars and leave me holding these April puts for $31.00, I know that I can roll them, or be assigned and collect the dividend, sell covered calls, buy stock to average down, sell puts lower to average down and a myriad of other strategies because I know that Microsoft is not going to disappear overnight but will continue to grow its earnings and eventually its stock will reflect those earnings.
Importance Of The Trader’s Journal
This is why the trader’s journal is so important. Take a moment and reflect on my trader’s journal on Microsoft Stock and you can see the value in this great company. By keeping a trader’s journal with the statistics of earnings, pe, dividend increases and more it gives me confidence to step in when opportunity is there. For example by quickly looking at the trader’s journal for Microsoft stock I can see that they have increased their dividend 30% since 2009! Yet their payout ratio is low at 25.8 times and declining from previous years. That is just one of the many signs telling investors this is a stock to consider put selling against.
Microsoft Stock Put Selling Opportunity Summary
There is not a lot more to be said about taking opportunity when it comes. I always consider put selling on my favorite stocks as they decline by taking small positions on the way down. If interested in the stock I would be taking small positions on the way down as well. All of this is based on my market timing technical indicators and my confidence that if I am wrong I can still work my trade into a profit.
Based on the present movement in the stock as well as all my market timing technical indicators, I believe Microsoft Stock is giving investors a chance to jump in and ride the next uptrend in the stock and for put selling, this could be an excellent opportunity to do put selling for some impressive premiums as Microsoft Stock falls and then rebounds.

