As regular readers of FullyInformed know, the Weekly Initial Unemployment Insurance Claims has proven to be one of the best Market Timing System methods. It has a long proven track record and is one I follow every Thursday. This Market Timing System can be used to spot pressure building to the downside for a major correction simply by the numbers themselves. You can read the entire article on that market timing system method through this link.
Nov 7 2013 Weekly Initial Unemployment Insurance Claims
Every Thursday the Weekly Initial Unemployment Insurance Claims are released. Today’s numbers show that Friday’s unemployment report should show more jobs being created.
The Weekly Initial Unemployment Insurance Claims fell more than expected to a seasonally adjusted 335,000. This figure shows that while roughly in line with estimates or slightly lower the robust job growth is not happening. In better market environments the Weekly Initial Unemployment Insurance Claims often come in at 250,000. We have not seen that type of number throughout the recovery period from the financial credit crisis.
Still though the numbers are okay and unemployment remains at 6 year lows but it continues to point to a somewhat lacklustre recovery. The biggest thing to take away from today’s Weekly Initial Unemployment Insurance Claims is that:
a) The next unemployment report should be okay. Not terrific, but okay.
b) The employment market remains stable.
c) There is no major market direction correction ahead. Based on the numbers we have seen over the past few weeks nothing would indicate a big plunge in the stock markets. The weekly initial unemployment claims has to be over 375,000 and climbing for severe corrections. While the Weekly Initial Unemployment Insurance Claims seem to stay around the 350,000 level there is no increase in the numbers which is as important as ddecreasing numbers according to the market timing system used.
Market Timing System – Weekly Initial Unemployment Insurance Claims Chart
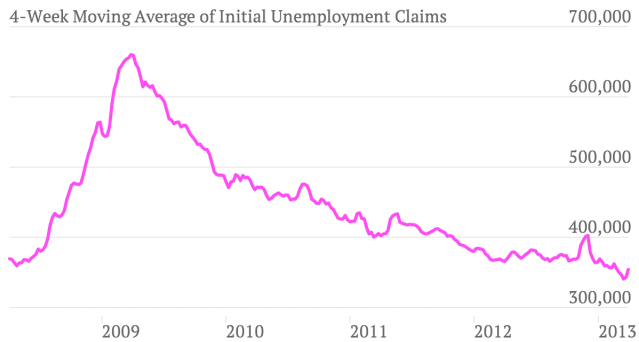
If we look at the 4 week moving Weekly Initial Unemployment Insurance Claims chart below from the US Department of Labor you can see that we bottomed out earlier in the year and are now stable between roughly 325,000 and 345,000 each week. While economists in general believe the rate of employment growth remains slow you can see in the chart that the results have been dramatic from 2009 and even from 2011 when the 4 week moving average was still above 400,000.

This chart from the US Department of Labor shows the 4 week moving average for Weekly Initial Unemployment Insurance Claims. For a market timing system is remains incredibly accurate.
Using This Market Timing System
The system is simple to use. Numbers above 350,000 weekly are normally followed by weakness in the market direction move higher. Numbers higher than 375,000 have almost always seen sell-offs. Numbers above 390,000 are signals that buying puts on the market or purchasing Ultra Short ETFs warrant attention from investors.
Today’s numbers should support higher prices for stocks in general and signal that dips in stocks should be bought or Put Selling done (which I am engaged in) as overall the market direction should move higher or certainly not collapse.
The Weekly Initial Unemployment Insurance Claims remains one of the better market timing systems which has withstood years of use. While nothing is foolproof, it is surprisingly accurate as a market timing system especially for longer-term trends. It cannot of course predict unforeseen events but it does provide a level of comfort when investing especially with the stock markets sitting at all-time high indexes.
Internal Market Direction Links
Profiting From Understanding Market Direction (Articles Index)
Understanding Short-Term Signals
Market Direction Portfolio Ongoing Trades (Members only)

