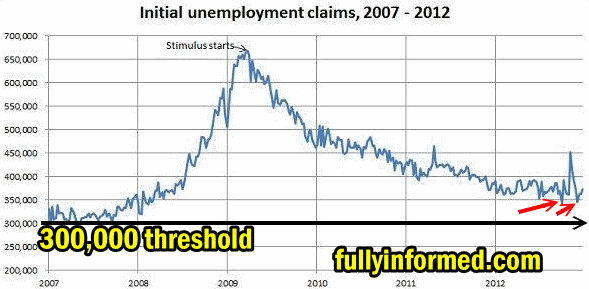
I have written a number of articles about this unique market timing system. That market timing system is based on the weekly USA initial unemployment insurance claims. In my article in July 2012 I explained how this simple system signals. You can read it through this link. The thing about this market timing system is that whenever the initial weekly initial unemployment insurance claims fall below 350,000 stocks rise and when it rises above the market has more trouble. Meanwhile when Weekly Initial Unemployment Insurance Claims head above 390,000 the stock markets have a lot of trouble and above 400,000 and markets tend to fall.
Market Timing System – Weekly Initial Unemployment Insurance Claims Chart
The chart below gives a good idea of this market timing system. In 2007 Weekly Initial Unemployment Insurance Claims were steadily below 350,000. As 2008 unfolded the number of claims started to rise and markets started to have trouble. You can see how by early 2009 the Weekly Initial Unemployment Insurance Claims had risen above 650,000 and the stock markets were in free fall.
You can see when stimulus started by the Federal Reserve in an effort to force interest rates lower and put a floor under housing and stimulate employment.

Market timing system based on the USA Initial Unemployment Insurance Claims
Present Market Timing System Forecast
Today’s news of Weekly Initial Unemployment Insurance Claims showed a drop of 37,000 bring the weekly numbers down to 335,000 which is below the 350,000 barrier. This is the lowest level since January 2008. This also puts the numbers within the reach of 300,000. If this happens the market direction will move a lot higher as obviously higher employment means more strength in the economy.
Today’s Weekly Initial Unemployment Insurance Claims were beyond the scope of what had been estimated. Analysts had called for the figure to be around 370,000 which in itself would have been good. Very few economist though felt that today’s number was much more than a one week blip. Instead they commented on the four-week average of claims which still was low than their estimates, coming in at 359,250.
Using This Market Timing System
Using this market timing system has resulted in a very good market direction predictions. If you look back at the Weekly Initial Unemployment Insurance Claims reports over the past three years you can almost match spikes in claims against pull backs in the S&P 500, Dow, NASDAQ and the Russell 2000.
This is one of the better market timing systems which has withstood the test of years of use A lot of other market timing systems do not stand up over short, medium and in particular longer periods of time. This market timing system is as good as the 200 day moving average for advising investors when to be cautious and when to consider adding more capital into trades.

