Market Timing is all about getting into the market for profits and getting out to protect those profits. Market direction is all about taking those timing indicators and knowing whether the next move is up or down in the overall markets.
One of the interesting aspects of market timing and market direction is sifting through recent history to find similarities and then wonder is the same thing is about to happen.
Market Timing / Market Direction Oct 11 2007 to March 17 2008 – 20.2% loss
On October 11 2007 the S&P made a new all time high of 1576.09 but my market timing indicators did not support the move higher. The next day the market commenced a sell-off which had its first major leg down end on March 17 2008. The loss for this first leg down was 20.2%.
This drop took a total of 6 months.
My market direction outlook did not change until later in May 2008.
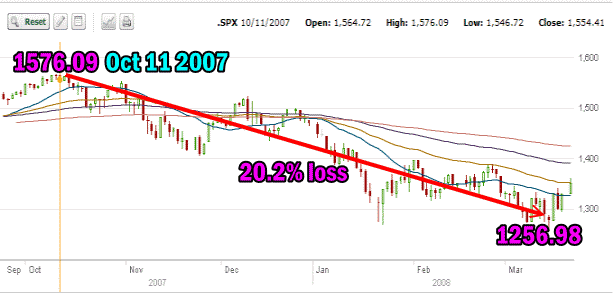
On Oct 11 2007 the S&P made a new all time high before selling commenced.
Market Timing / Market Direction March 17 2008 to May 19 2008 – 14.5% gain
March 17th marked the end of that decline and the market direction changed as the S&P rallied strongly for two months ending with a 14.5% gain on May 19 2008. This market direction change fooled most analysts who believed the market had recovered and would challenge the Oct 11 high.
Instead the original 20 % decline should have told investors that a bear market was well underway.
My market timing indicators changed to positive after two weeks into the rally and turned indecisive by May 19 2008. They did not pick the top on May 19 2008 but two weeks later they went solidly bearish and remained bearish throughout the 2008 collapse.
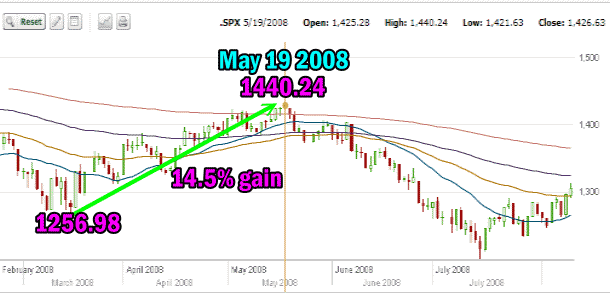
The climb back from the March 17 2007 low marked the first bear market rally of 2007
Market direction changed again and on May 19 2008 a drop commenced to a new lower low. There was no doubt this was a bear market. What followed from here every investor remembers.
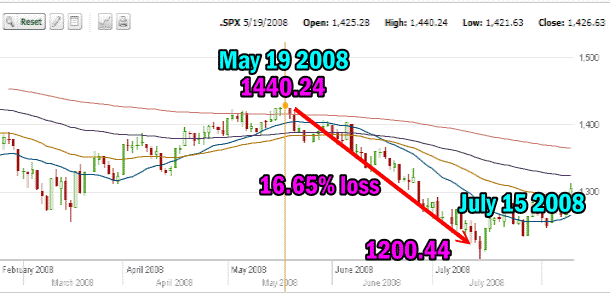
The second leg down in the bear market saw a lower low and a 16.65% loss.
Market Timing / Market Direction – The Bear Market of 2011 To Oct 28 2011
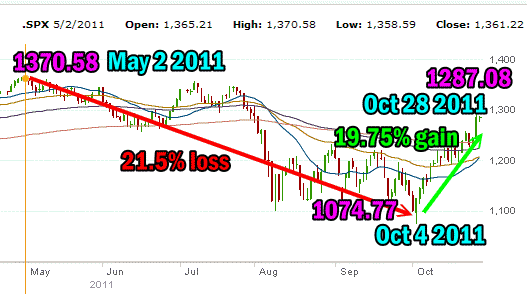
My market timing indicators have pointed to a market down for almost 5 months. It missed the top but never turned positive even with the rise in July. On May 2nd 2011 the recent bull market made the highest point for the bull market.
The collapse to Oct 4 2011 marked 6 months just like the first leg down in the 2007-2008 bear market and the loss was almost the same.
The rise from October 4 has been stronger than the rise from the March 17 2008 first leg down. However just as in the rise in May 2008, analysts are calling an end to the past 6 month bear market. Are they right?
My market timing indicators are showing that while the 20, 50, 100 and 200 day indicators are starting to turn back up, none have confirmed an end to this bear market. If this is a full-fledged bear market, then Oct 4 2011 marked the first leg down.
Market Timing / Market Direction – S&P 2010 Correction
The 2010 market correction was not as severe as the recent bear market activity. While the market timing indicators did show that selling was increasing as the market fell, they did not show the same degree of concern as this year’s bear market. The loss of 17.12% while on the high side of a market correct, did not reach the 20% true bear market territory.
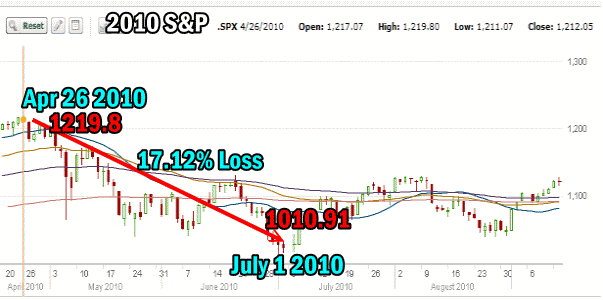
The 2010 market correction was not as severe as the 2011 bear.
Market Timing / Market Direction – Similarities Between 2007 and 2011
While there are a great deal of similarities and for many investors almost spooky so, the markets are in my opinion quite different. With the S&P 500 in 2007 setting new highs, stocks were over-valued. Today earnings from the majority of companies in the S&P are higher than in 2007 and valuations on many are lower.
However the other striking similarities are the financial crisis, which has moved for the present to Europe from the United States. High unemployment plagues the United States and parts of Europe. The housing crisis has not ended in the US and in Canada housing today is more expensive in most major cities than back in 2007 while real wages in Canada have not kept pace with rising housing costs.
The sub-prime mortgage mess is still sitting on the balance sheets of US banks and the economy is not robust in almost every developed nation.
As an investor I have survived everything from the oil crisis of the 1970’s to 1980’s double-digit inflation and 1987 one day plunge to the savings and loans scandal, Enron, WorldCom, 9/11, Lehman Brothers, AIG, 2008 bear market collapse and now into the European debt crisis. Through it all I have stayed the course, but it is always interesting to look back and take a moment to check my market timing indicators to determine if the market direction is about to change. It is when looking back that as an investor I can spot some very striking similarities in both market timing indicators, market direction calls and the market itself.
Today, just like in May 2008 when it appeared the bear market had ended, my market timing indicators and market direction outlook remain indecisive.

